Benchmarks
Setup
The benchmark plots below were produced on an Apple MacBook Pro M4 (10 performance cores and 4 efficiency cores), using the UmaDB Rust gRPC client to make gRPC requests to UmaDB gRPC server listening on http://127.0.0.1:50051.
Conditional Append
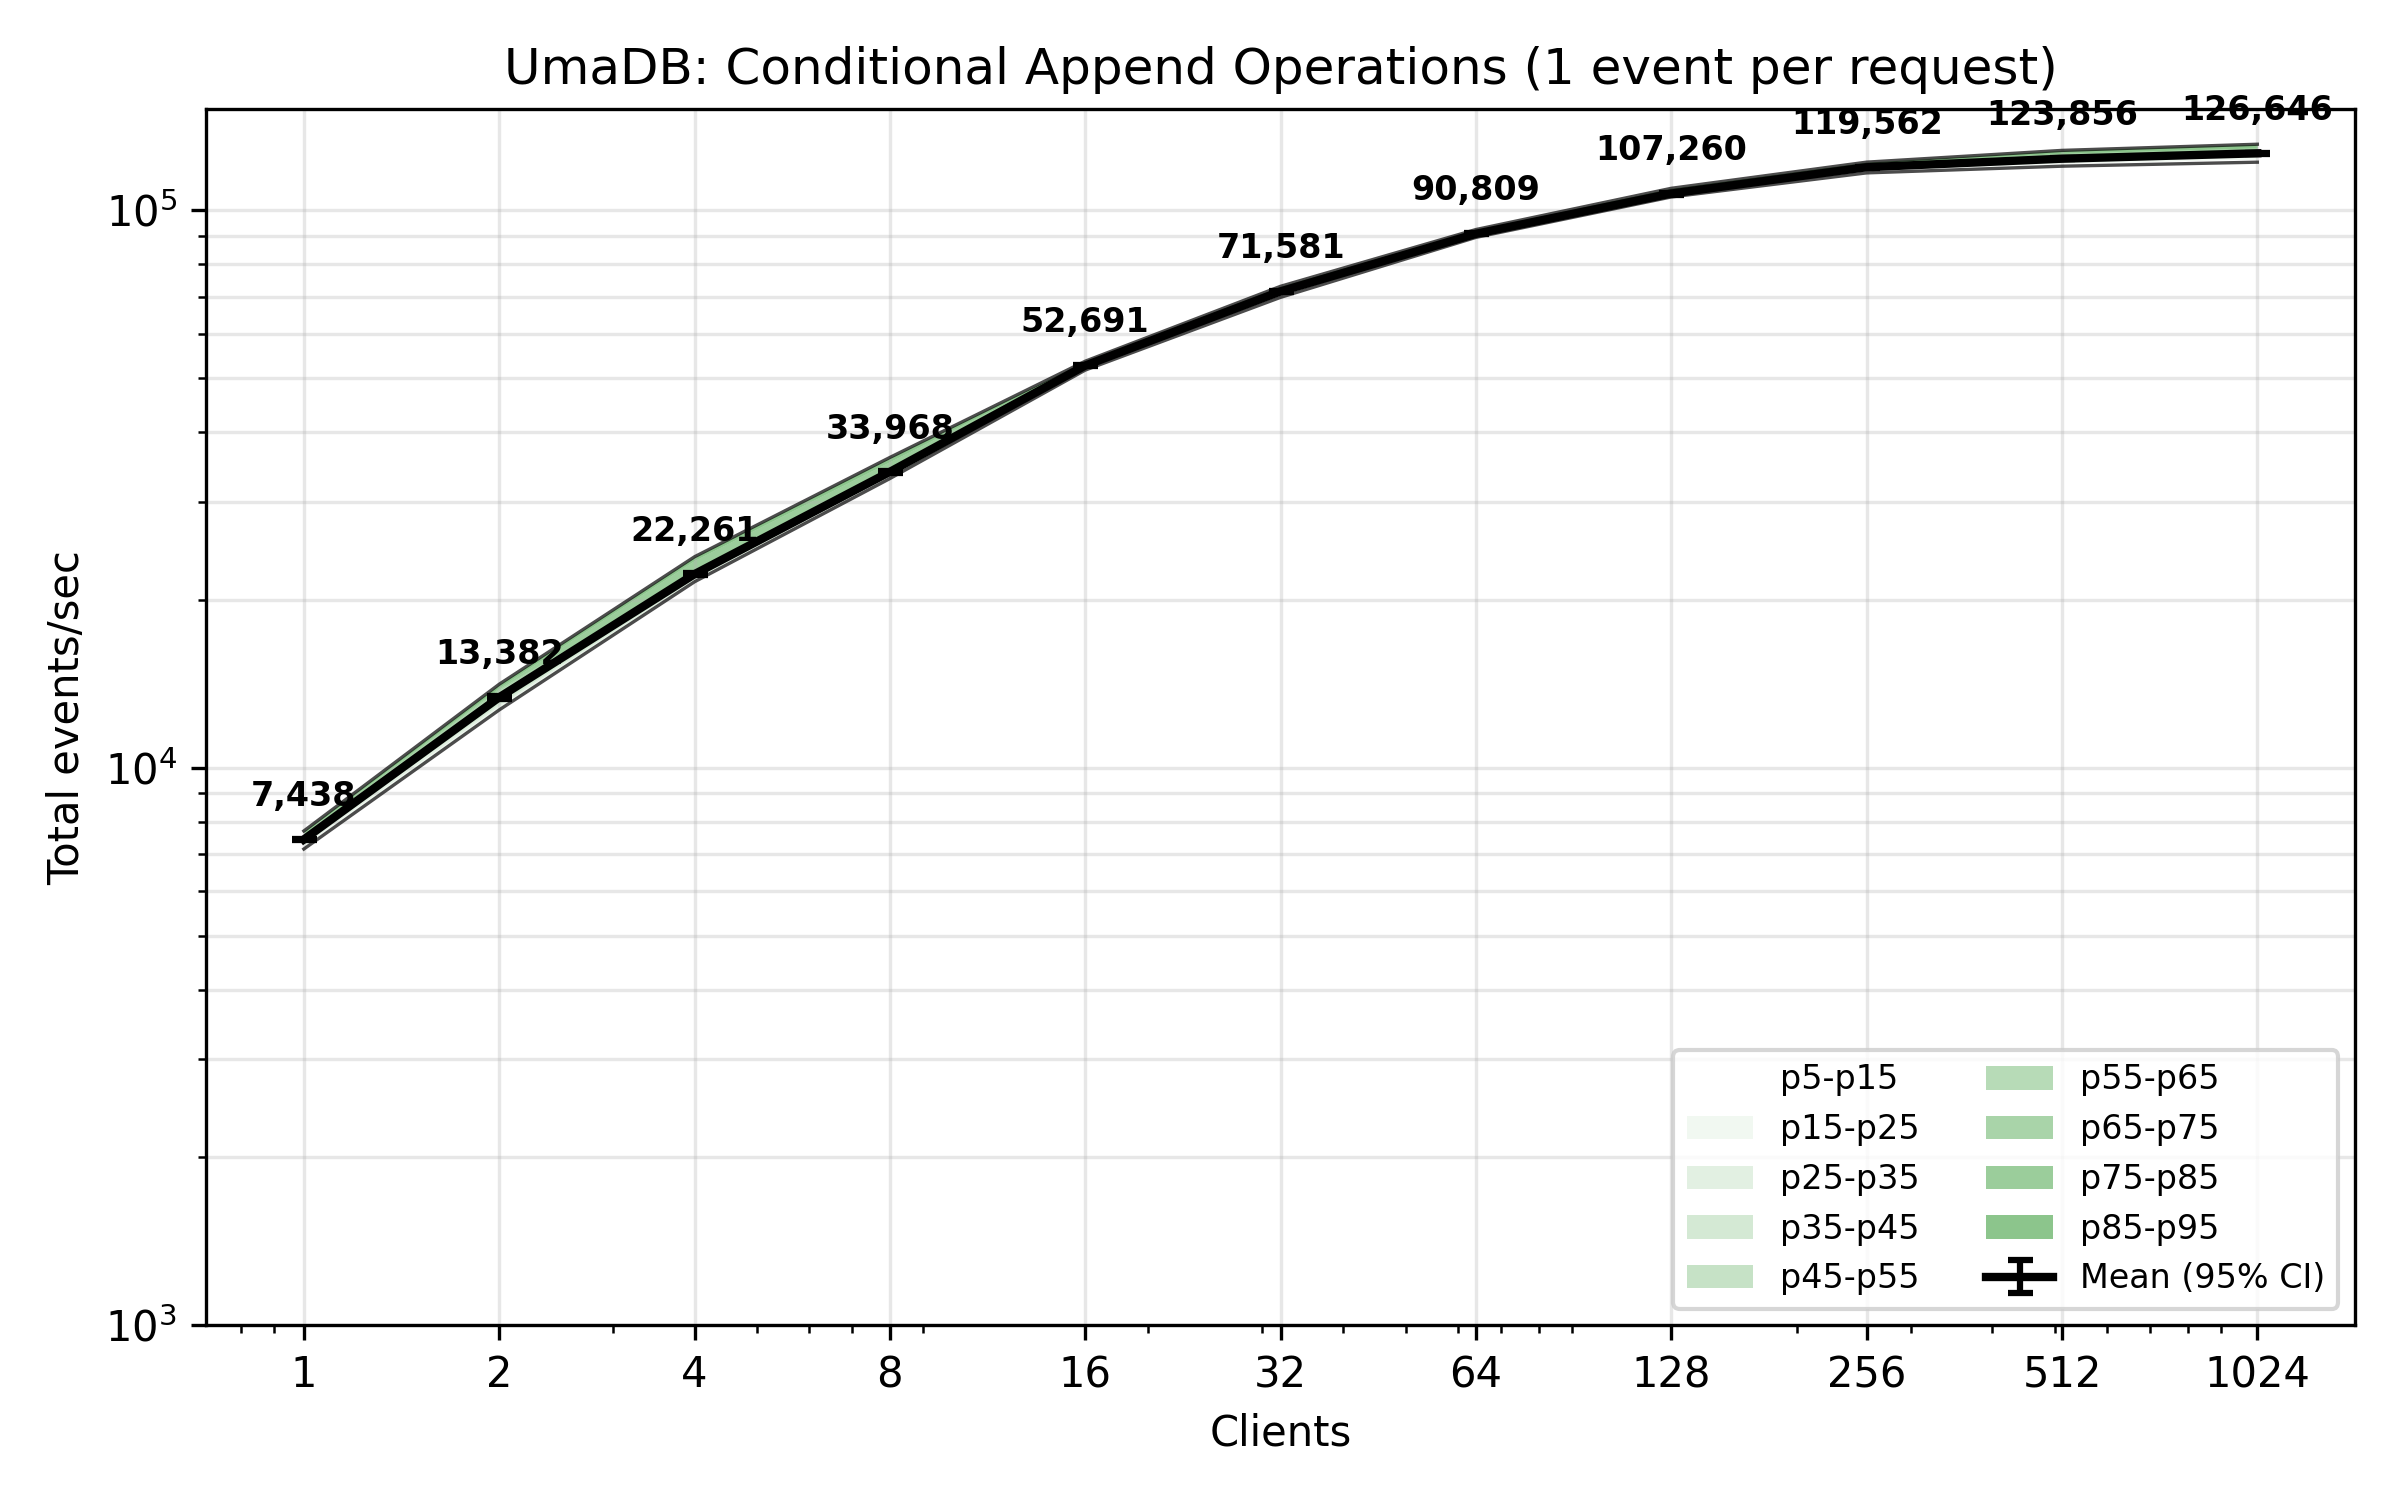
The benchmark plot below shows total appended events per second from concurrent clients. Each client is writing one event per request with an append condition. These are the kinds of requests that would be made by an application after a decision model has generated a new event.
The database was pre-populated with 1,000,000 events. During low concurrency, the rate is limited by the fixed overhead of a durable commit transaction, which is amortized for concurrent requests by batching append requests. During high concurrency, the limiting factor becomes the actual volume of data being written.
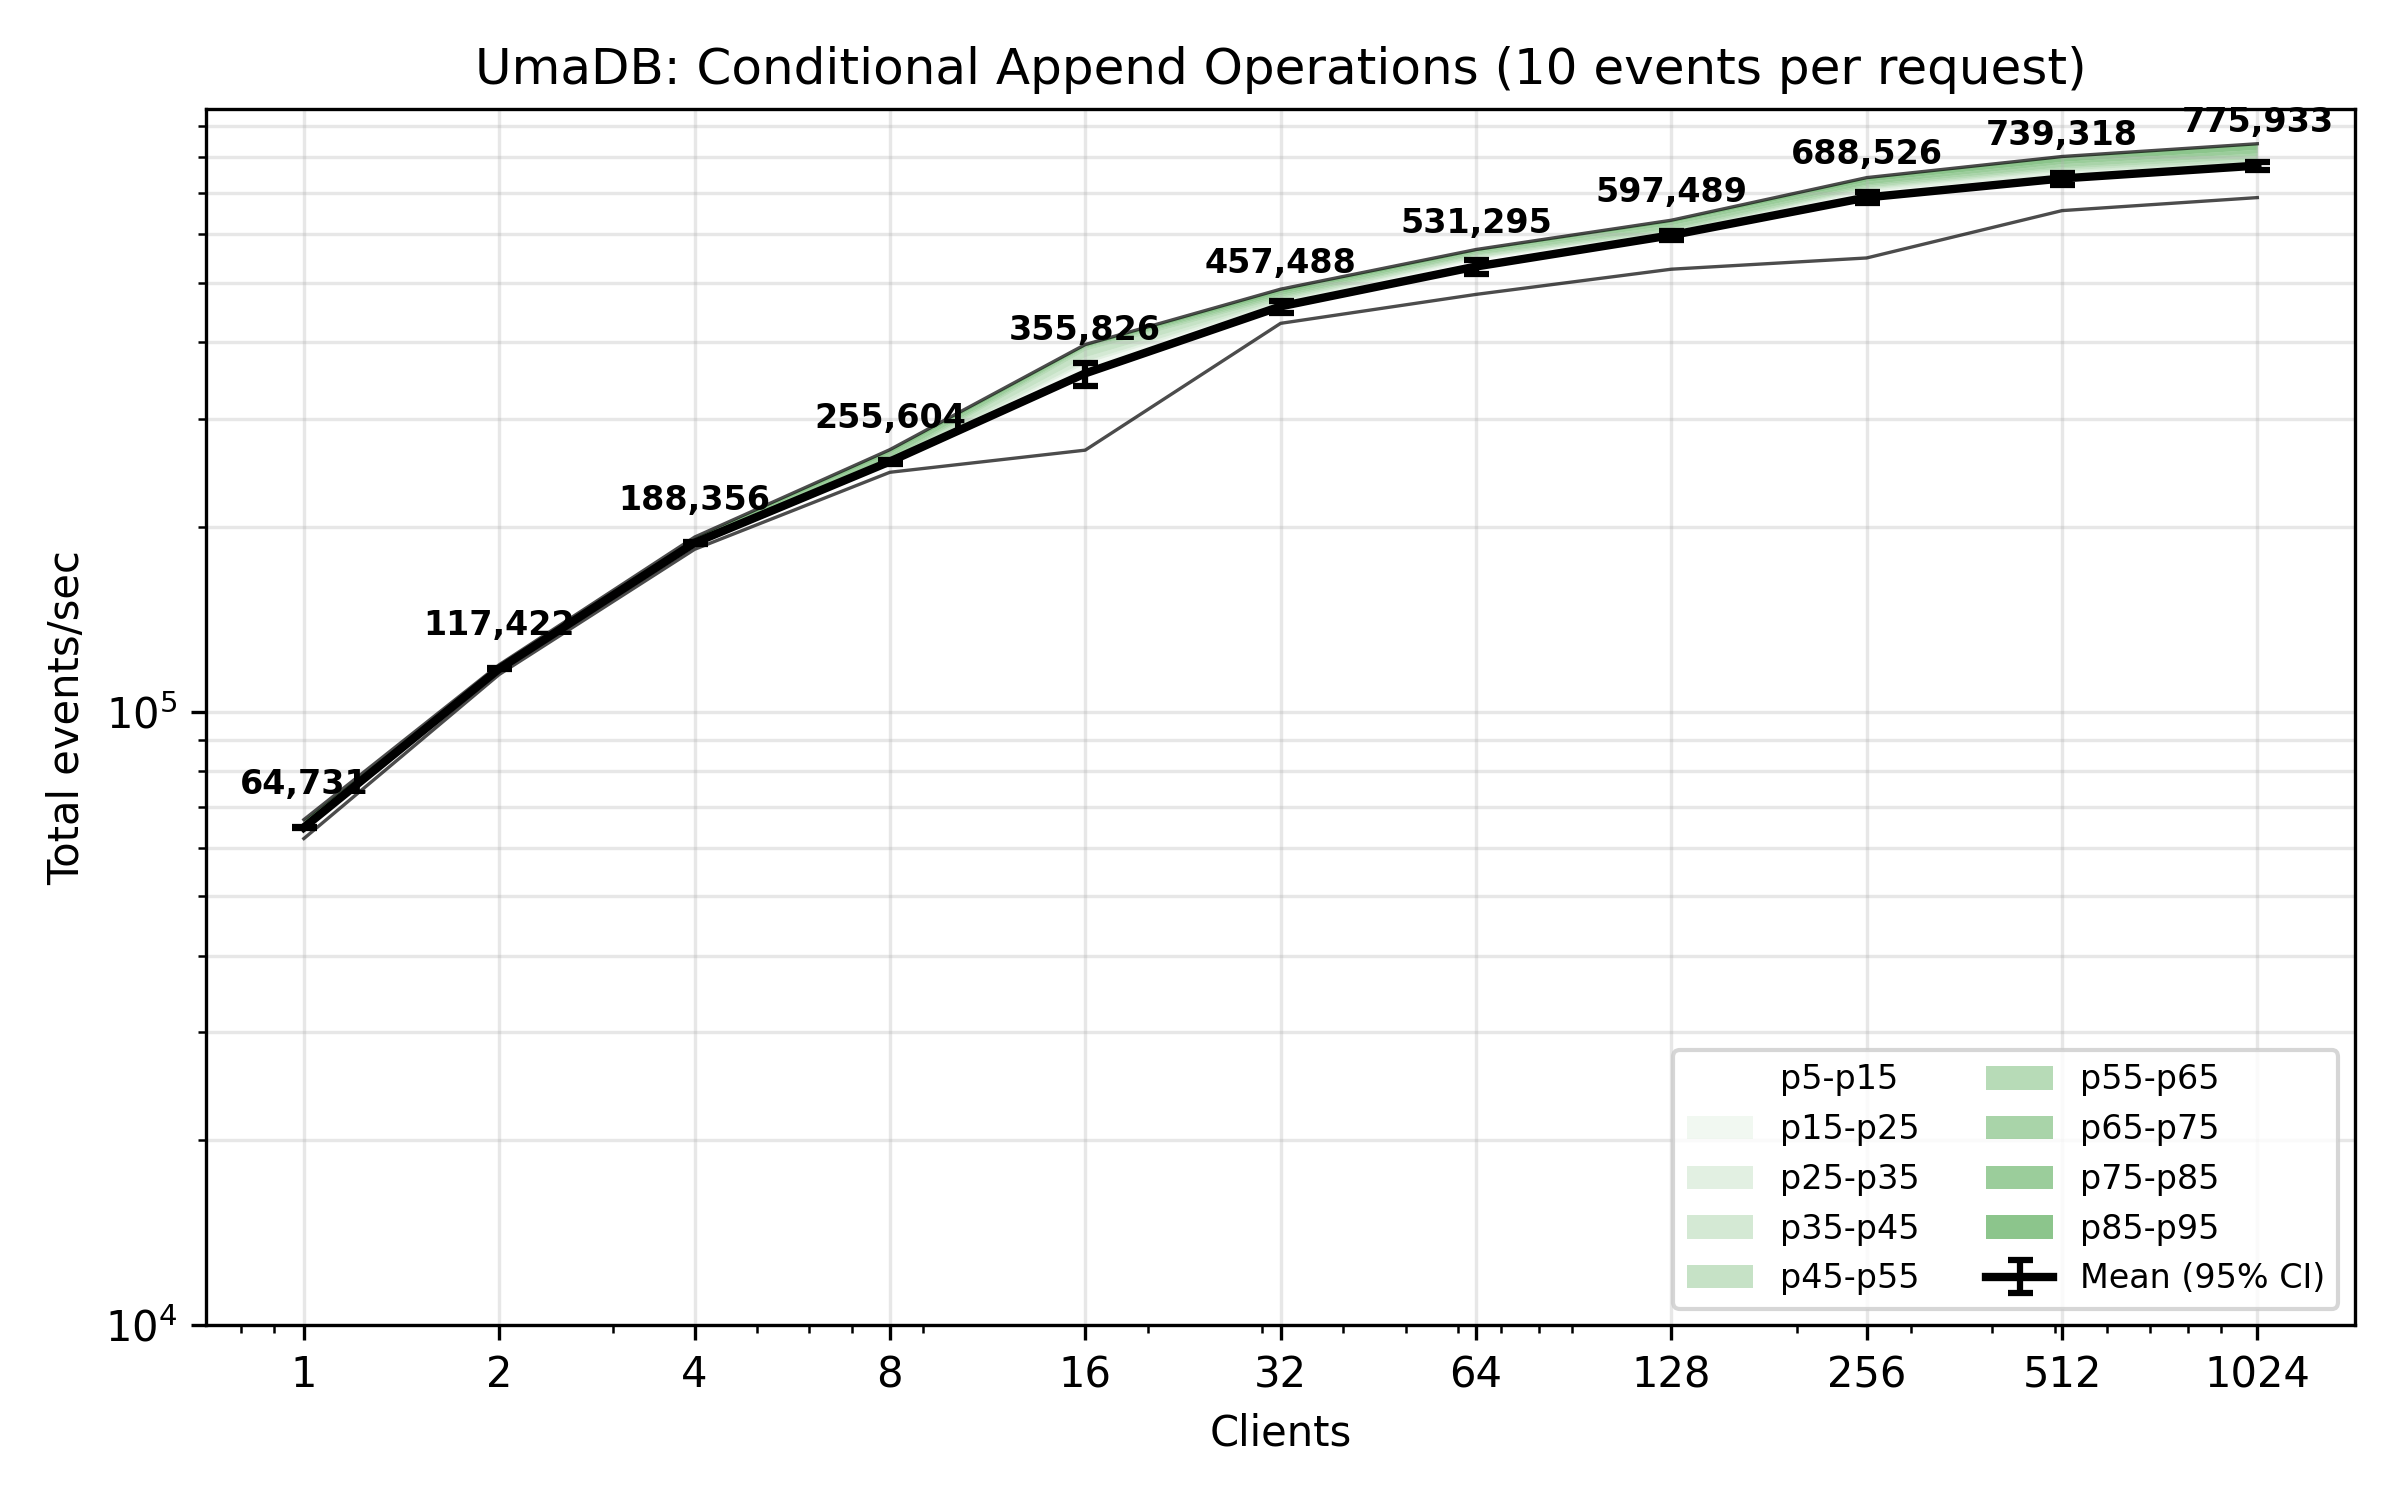
The benchmark plot below shows total appended events per second from concurrent clients. Each client is writing 10 events per request with an append condition.
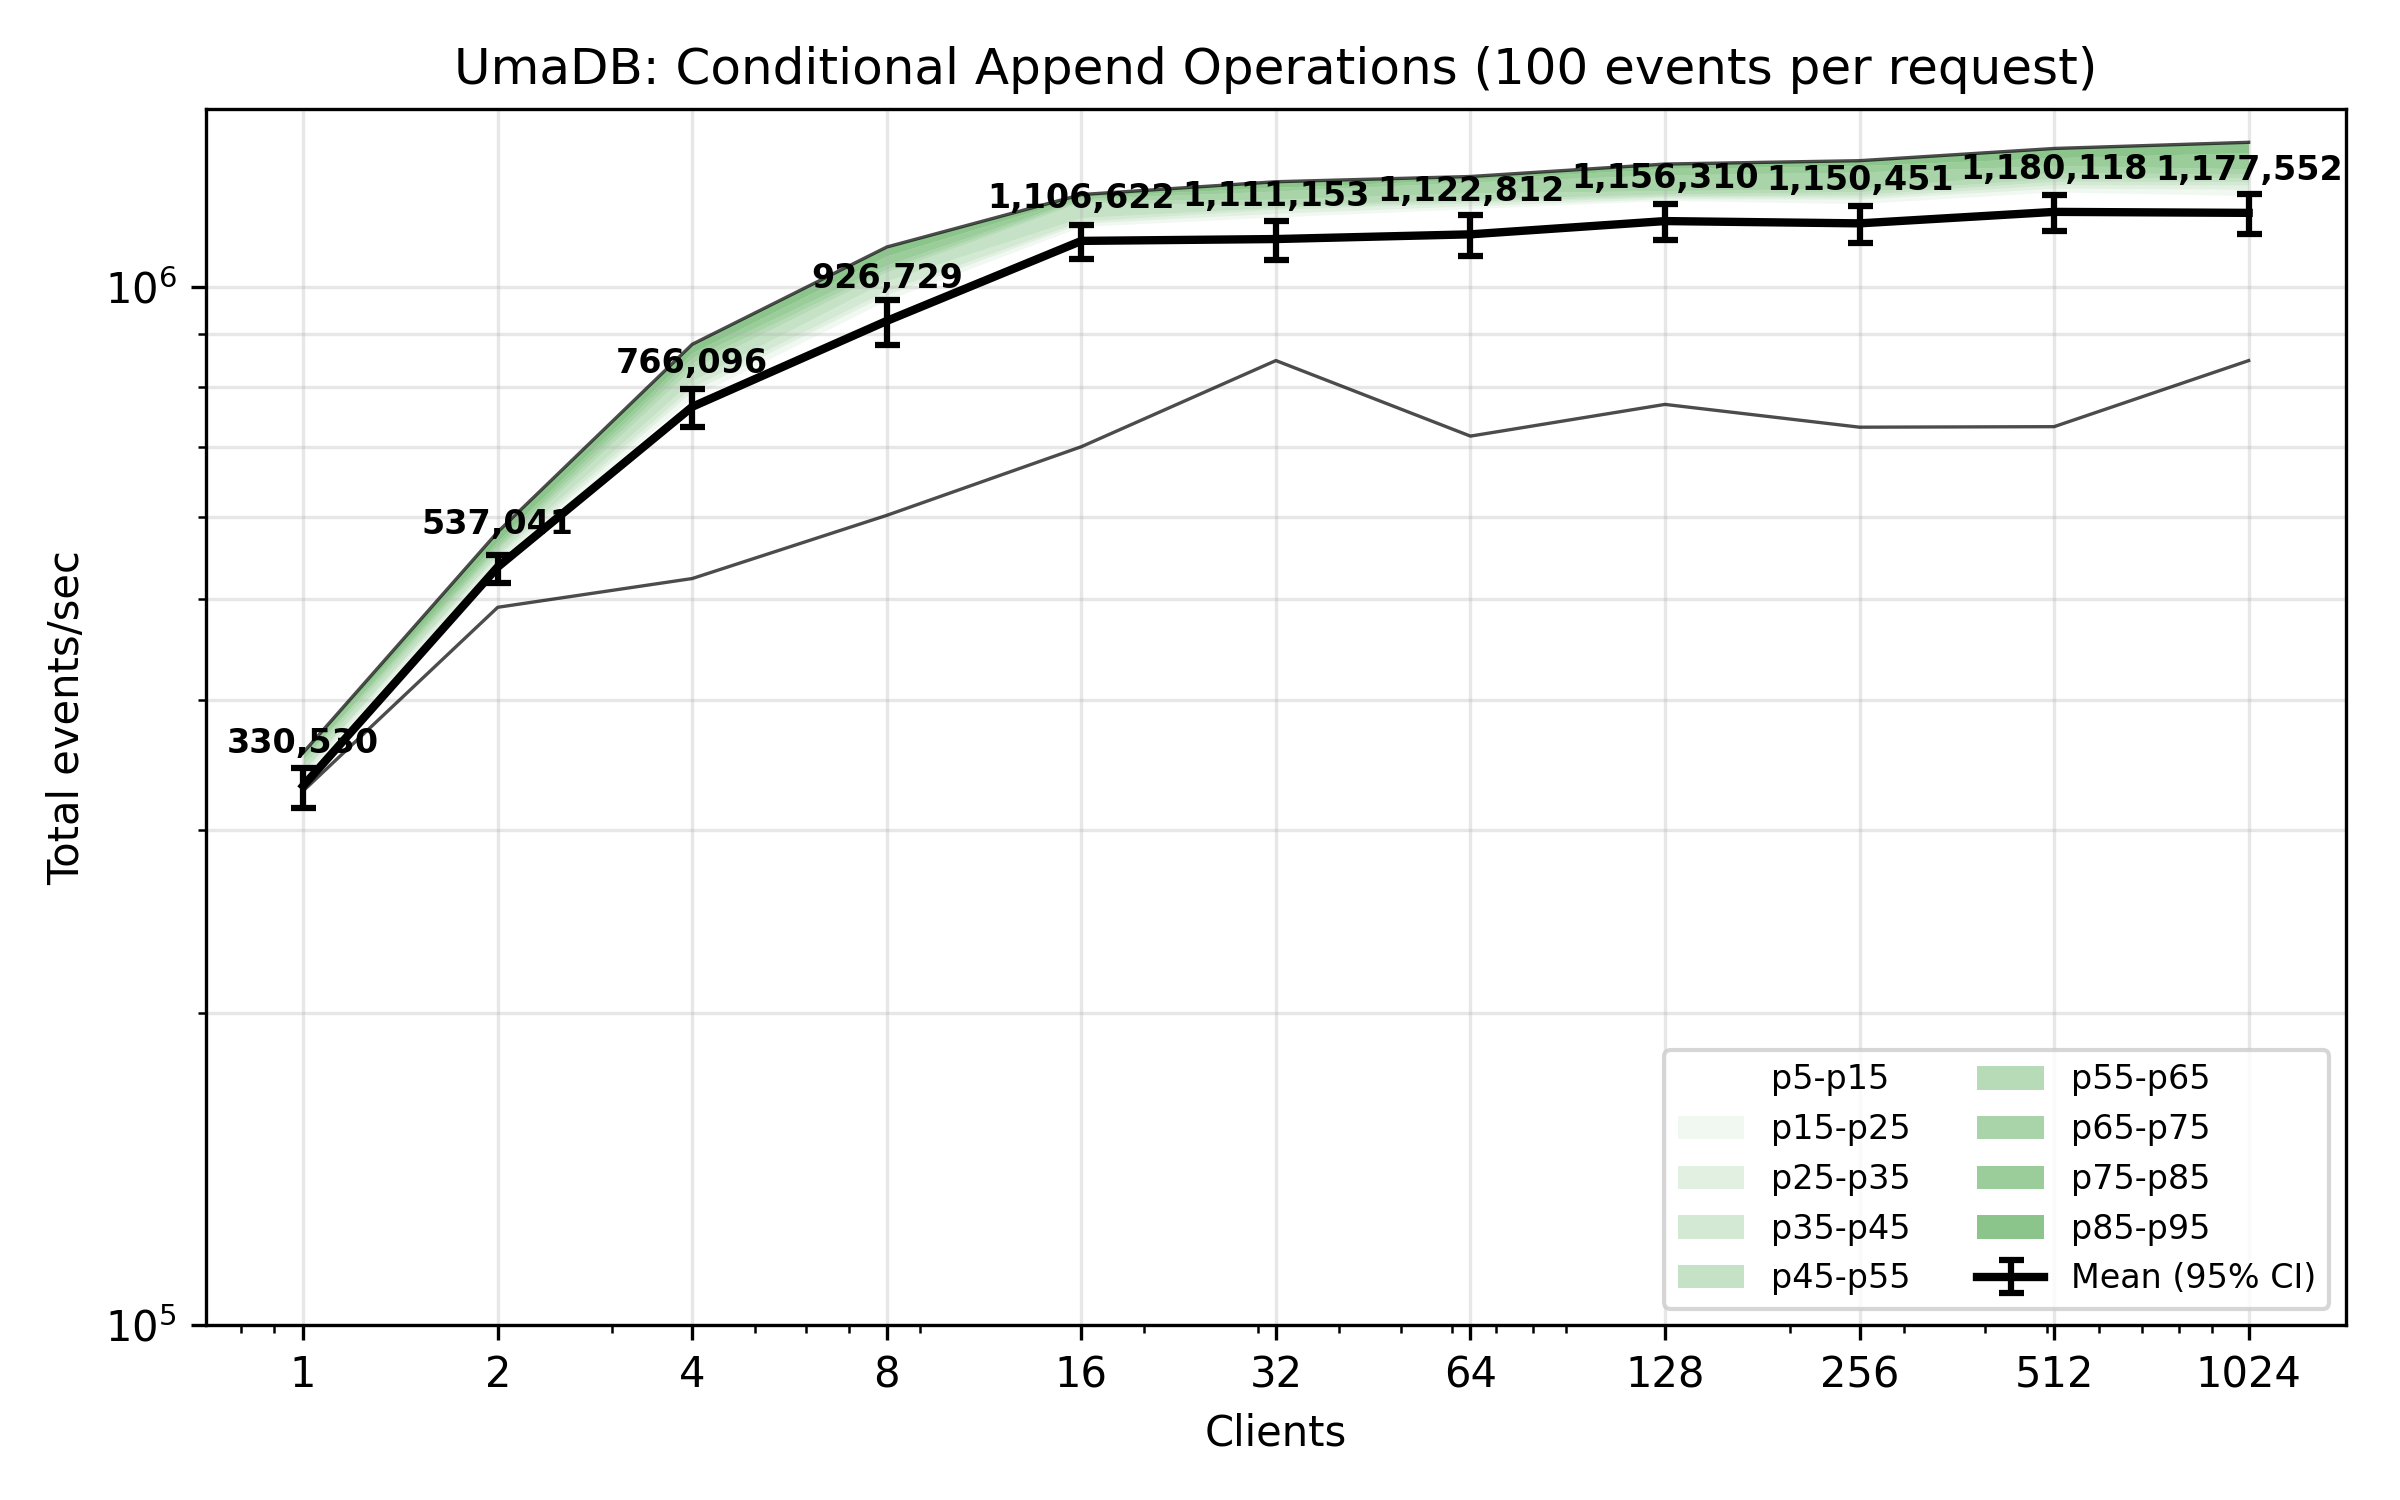
The benchmark plot below shows total appended events per second from concurrent clients. Each client is writing 100 events per request with an append condition.
Unconditional Append
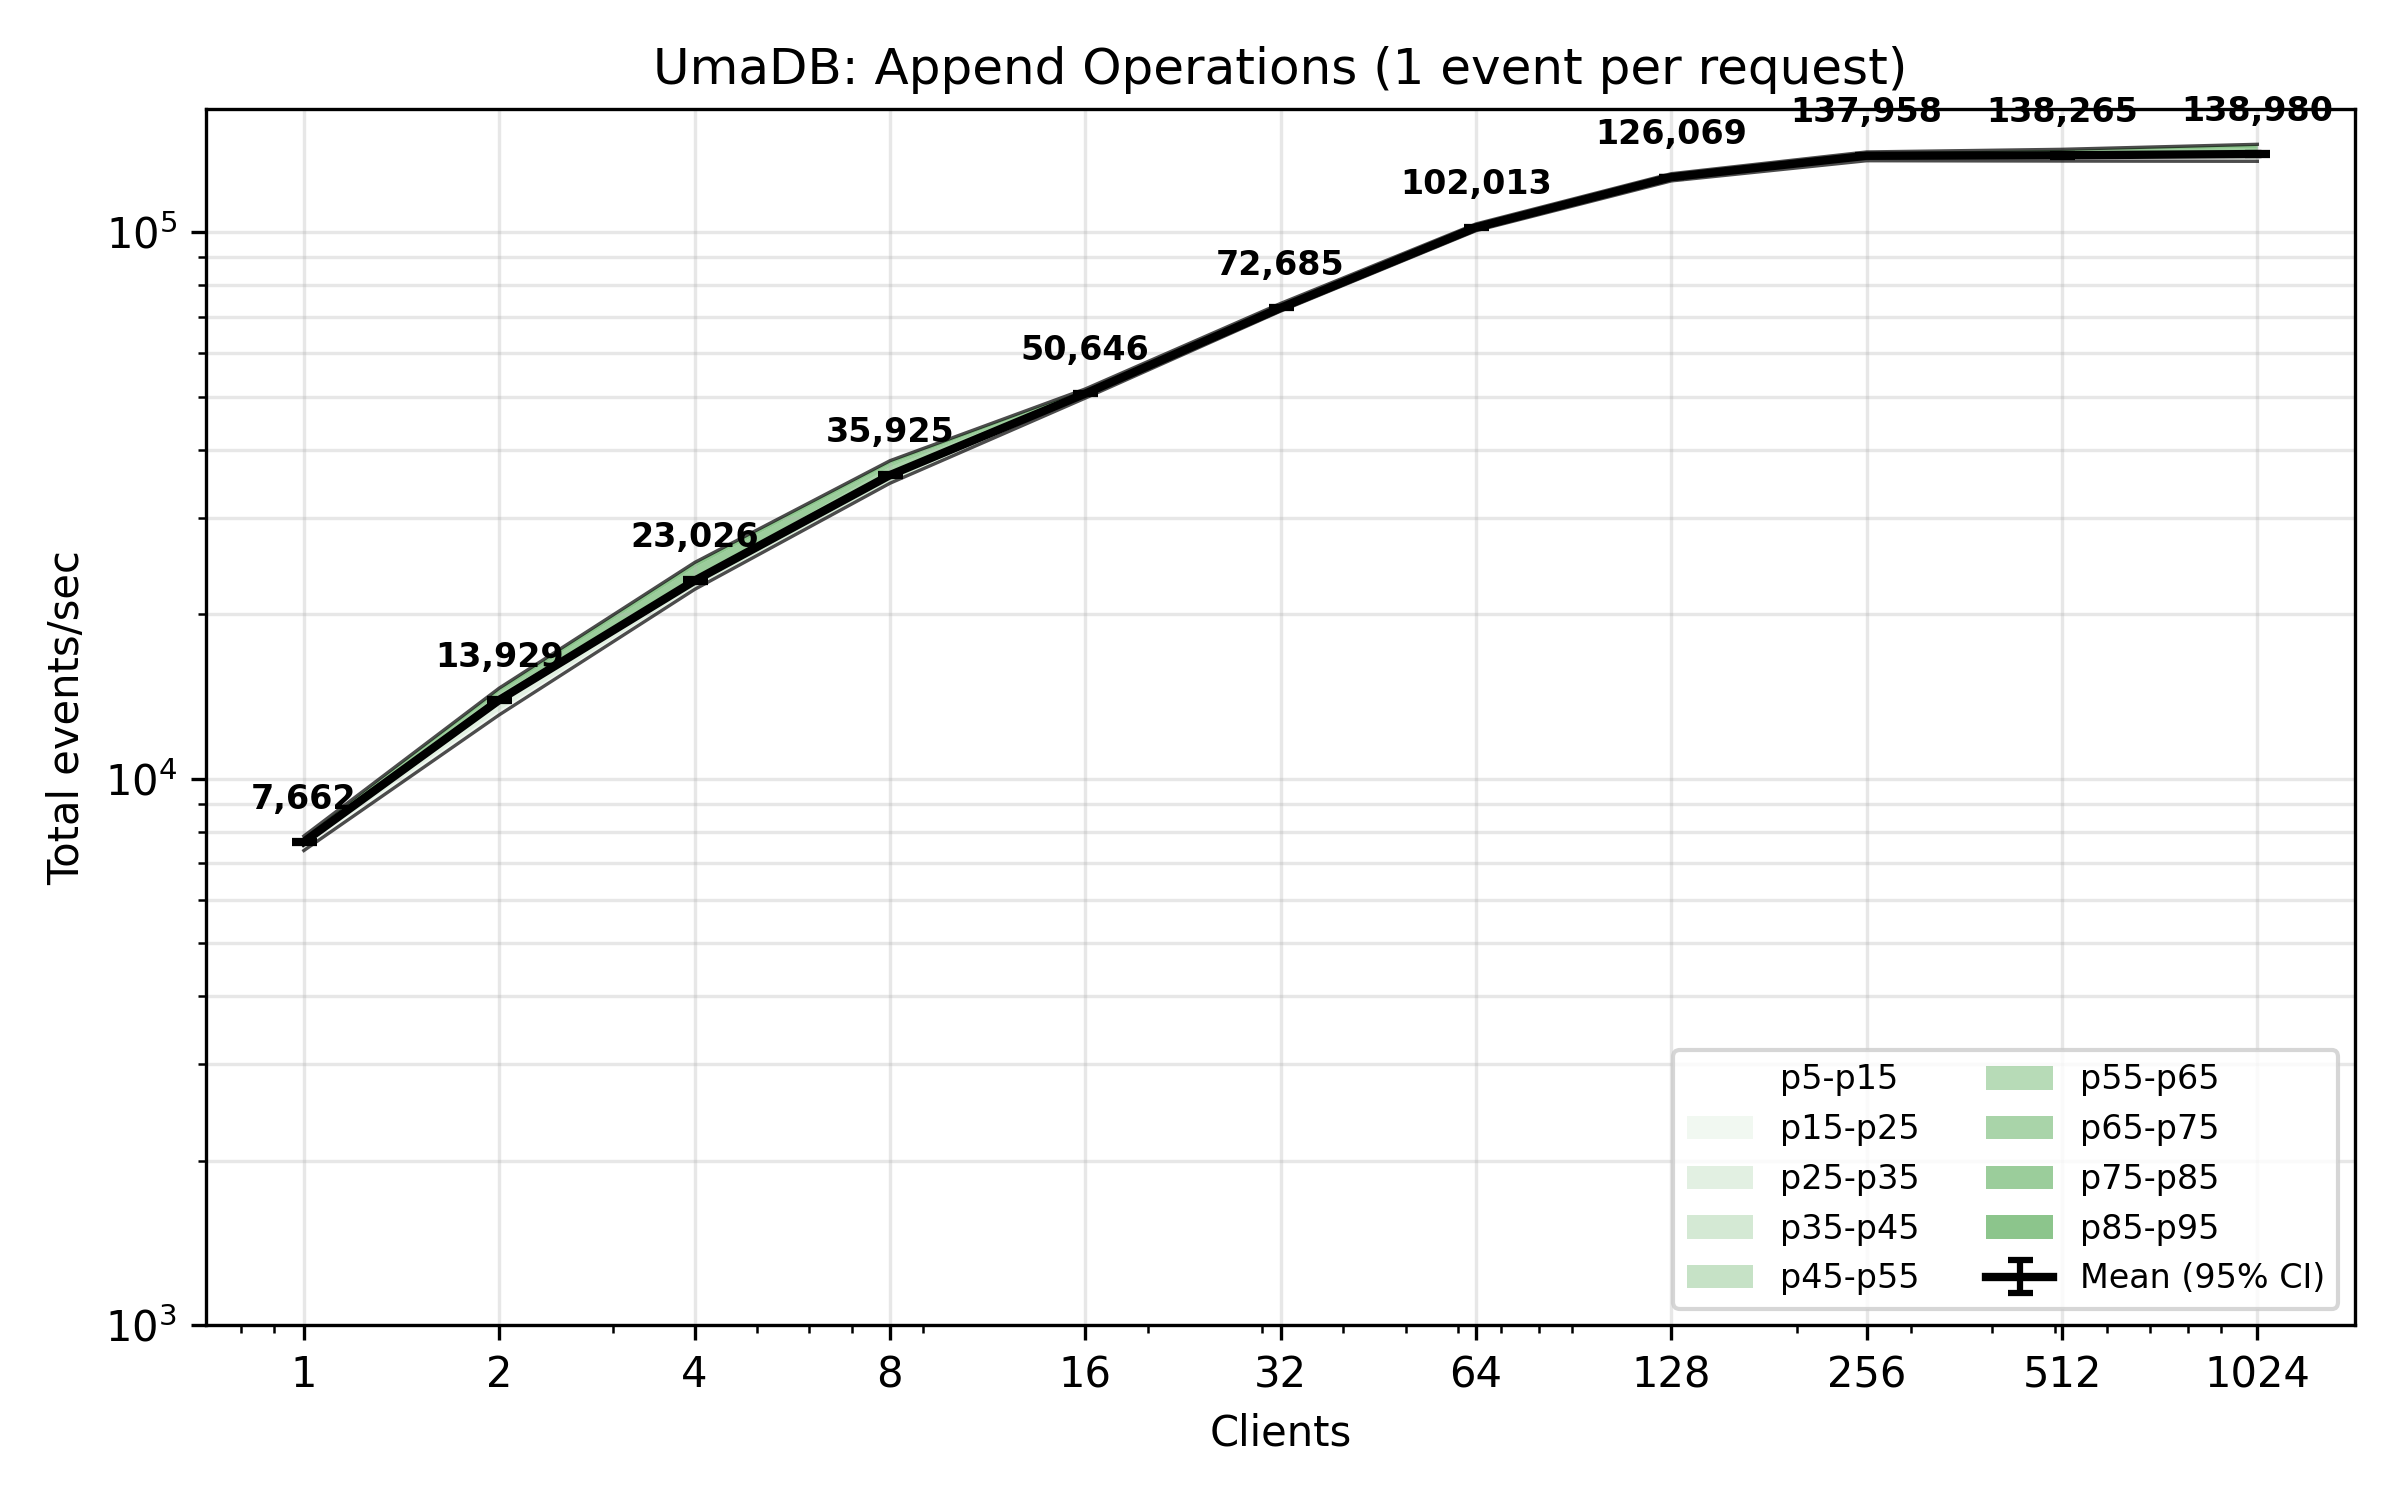
The benchmark plot below shows total appended events per second from concurrent clients. Each client is writing one event per request (no append condition). By comparison with the performance of the conditional append operations above, we can see evaluating the append condition doesn't affect performance very much. The database was pre-populated with 1,000,000 events.
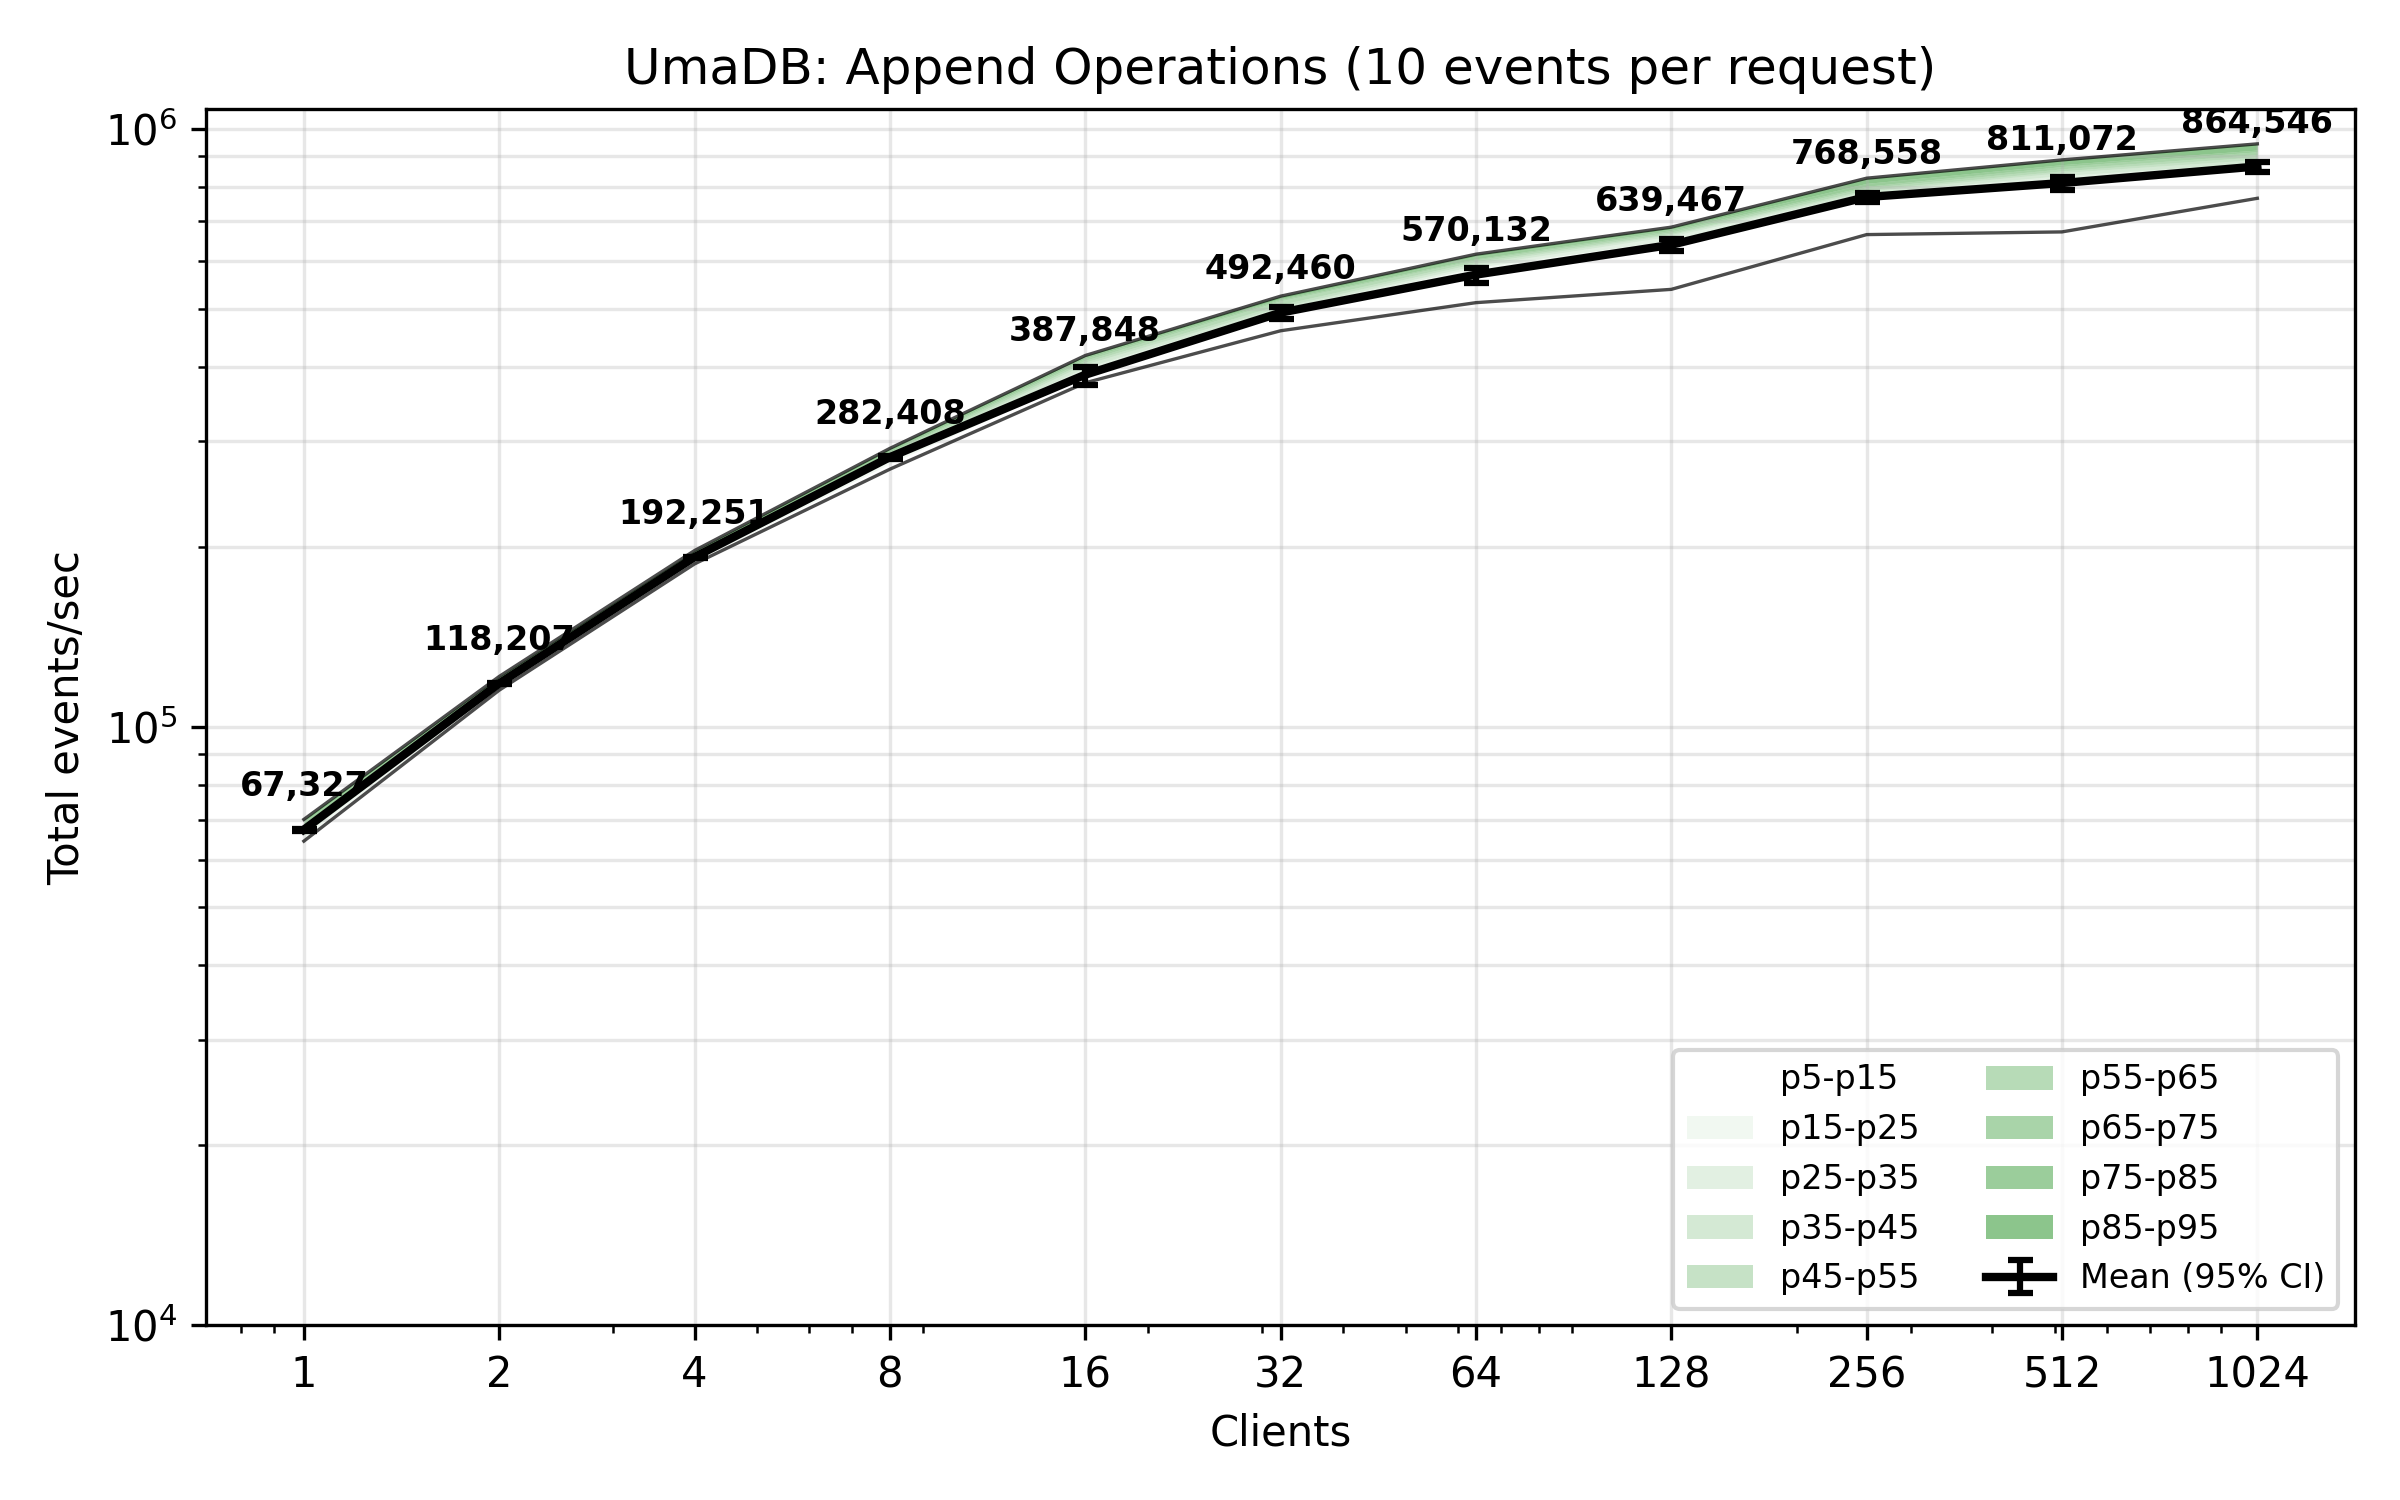
The benchmark plot below shows total appended events per second from concurrent clients. Each client is writing 10 events per request (no append condition).
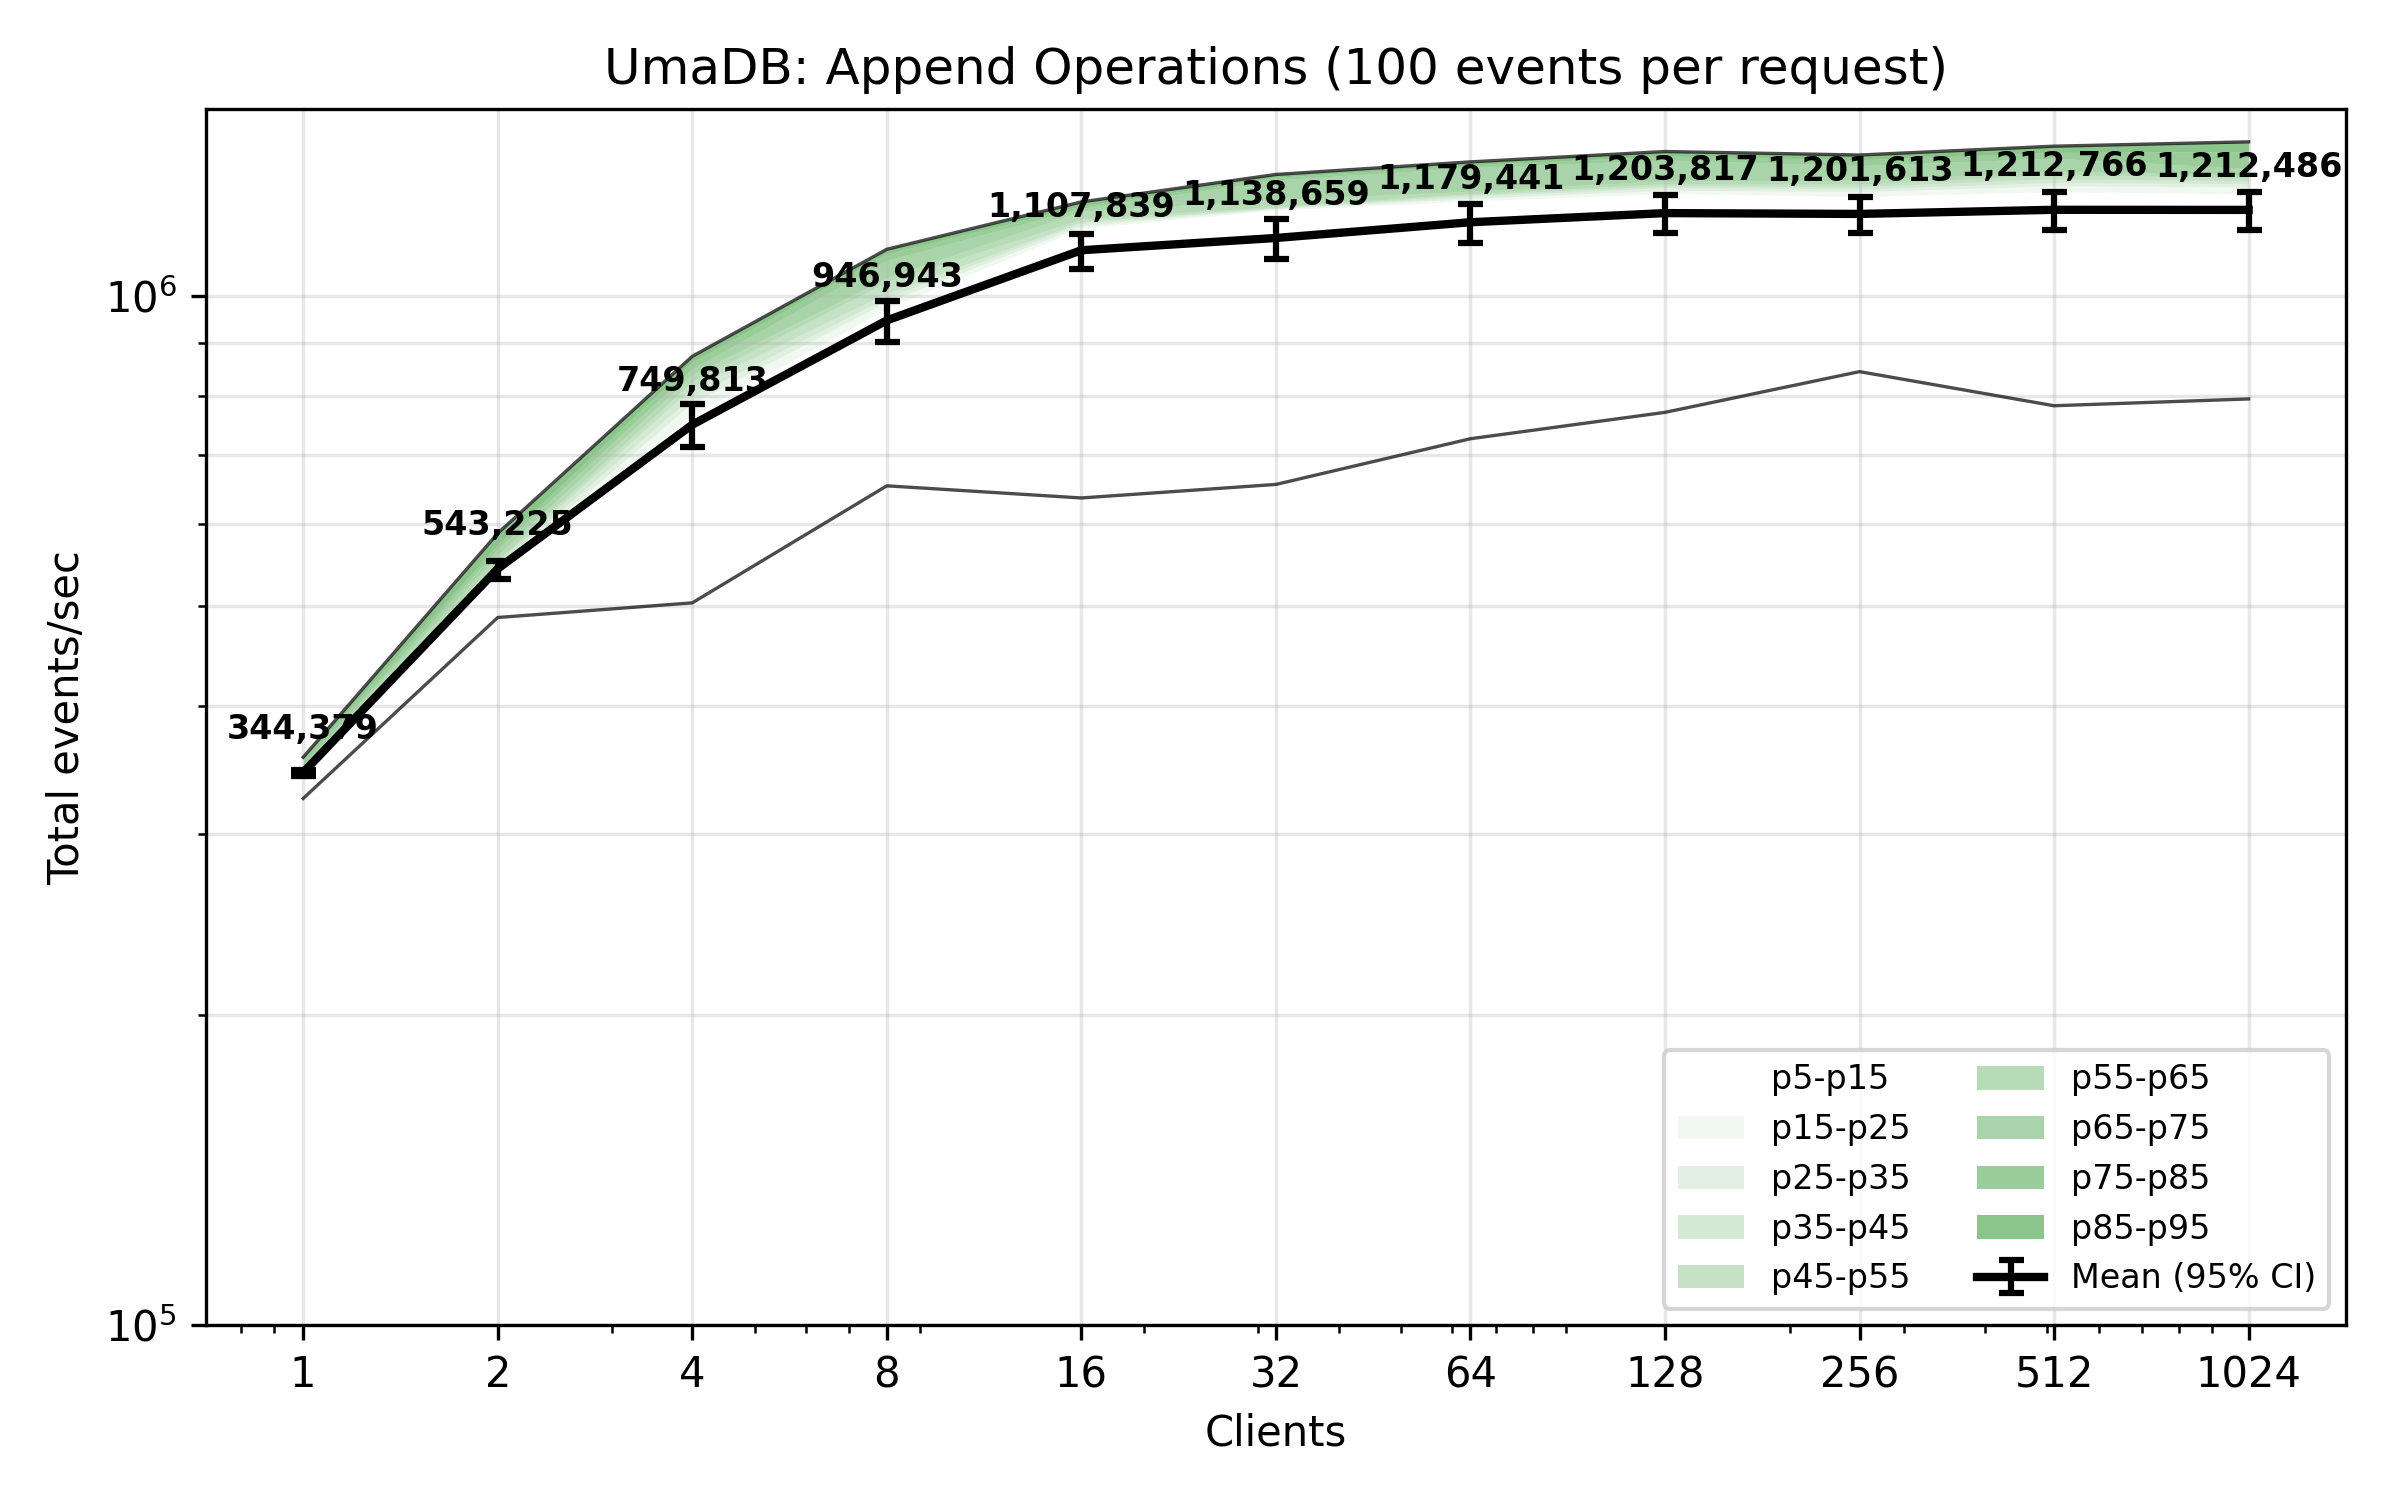
The benchmark plot below shows total appended events per second from concurrent clients. Each client is writing 100 events per request (no append condition).
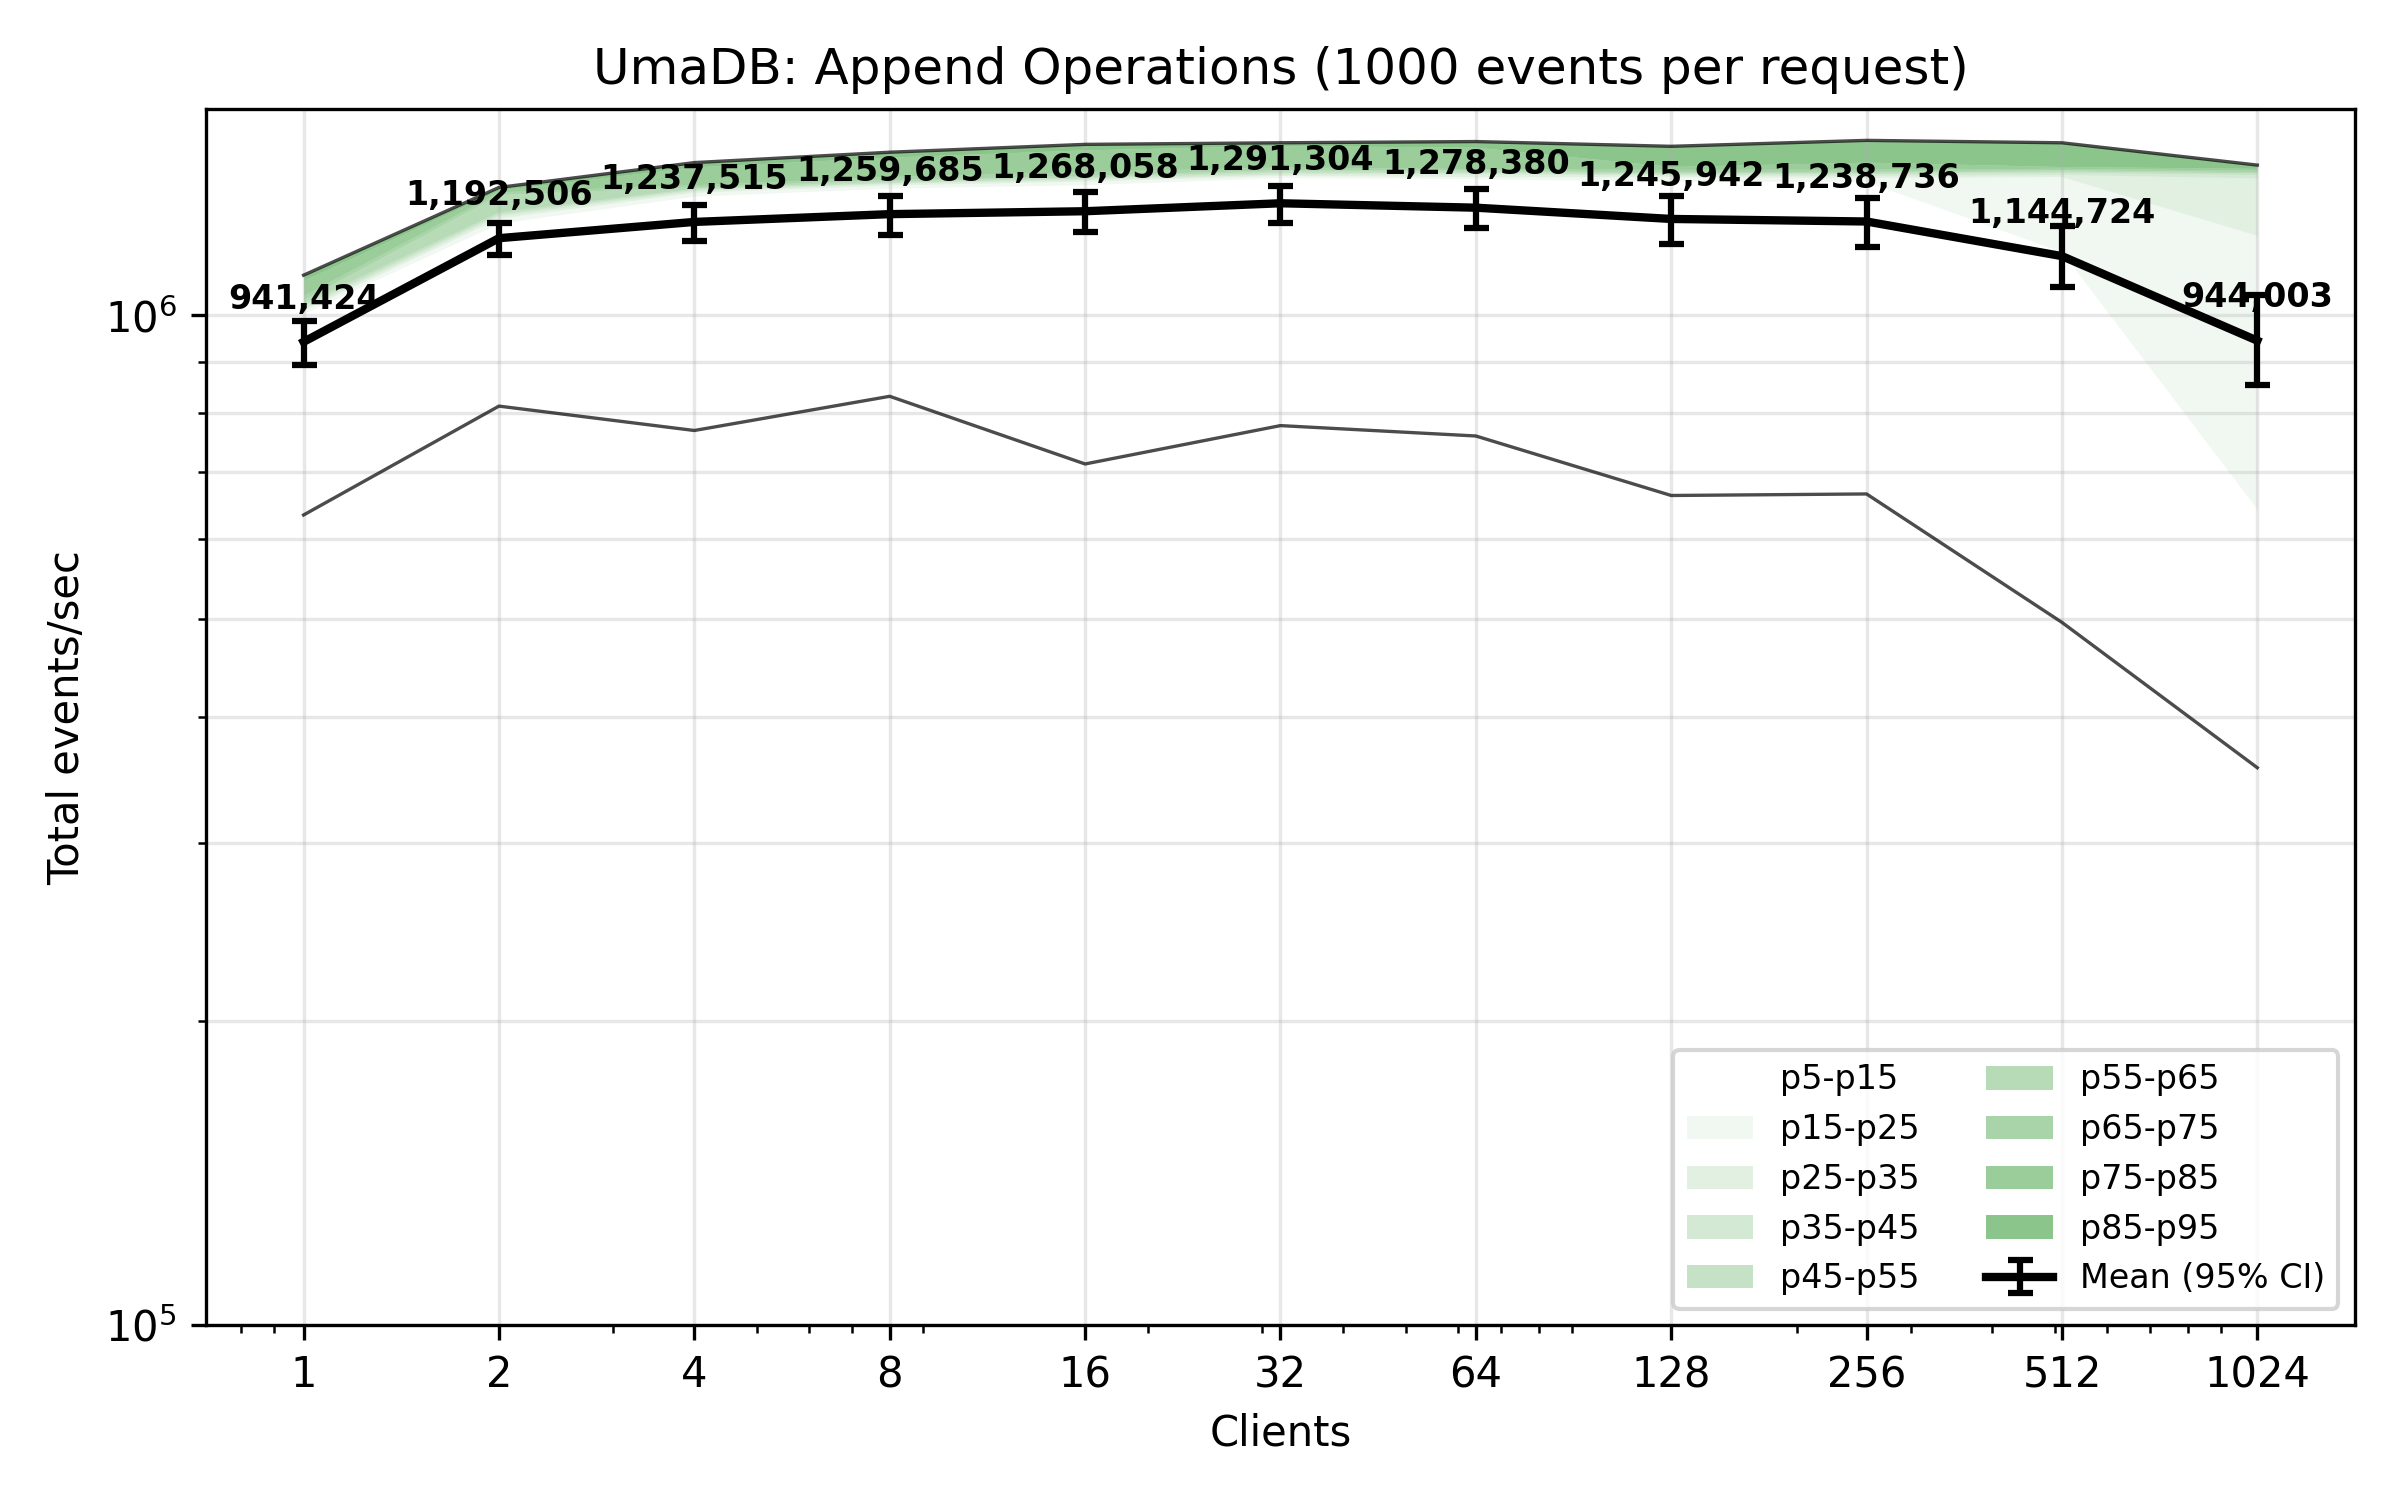
The benchmark plot below shows total appended events per second from concurrent clients. Each client is writing 1000 events per request (no append condition).
Conditional Read
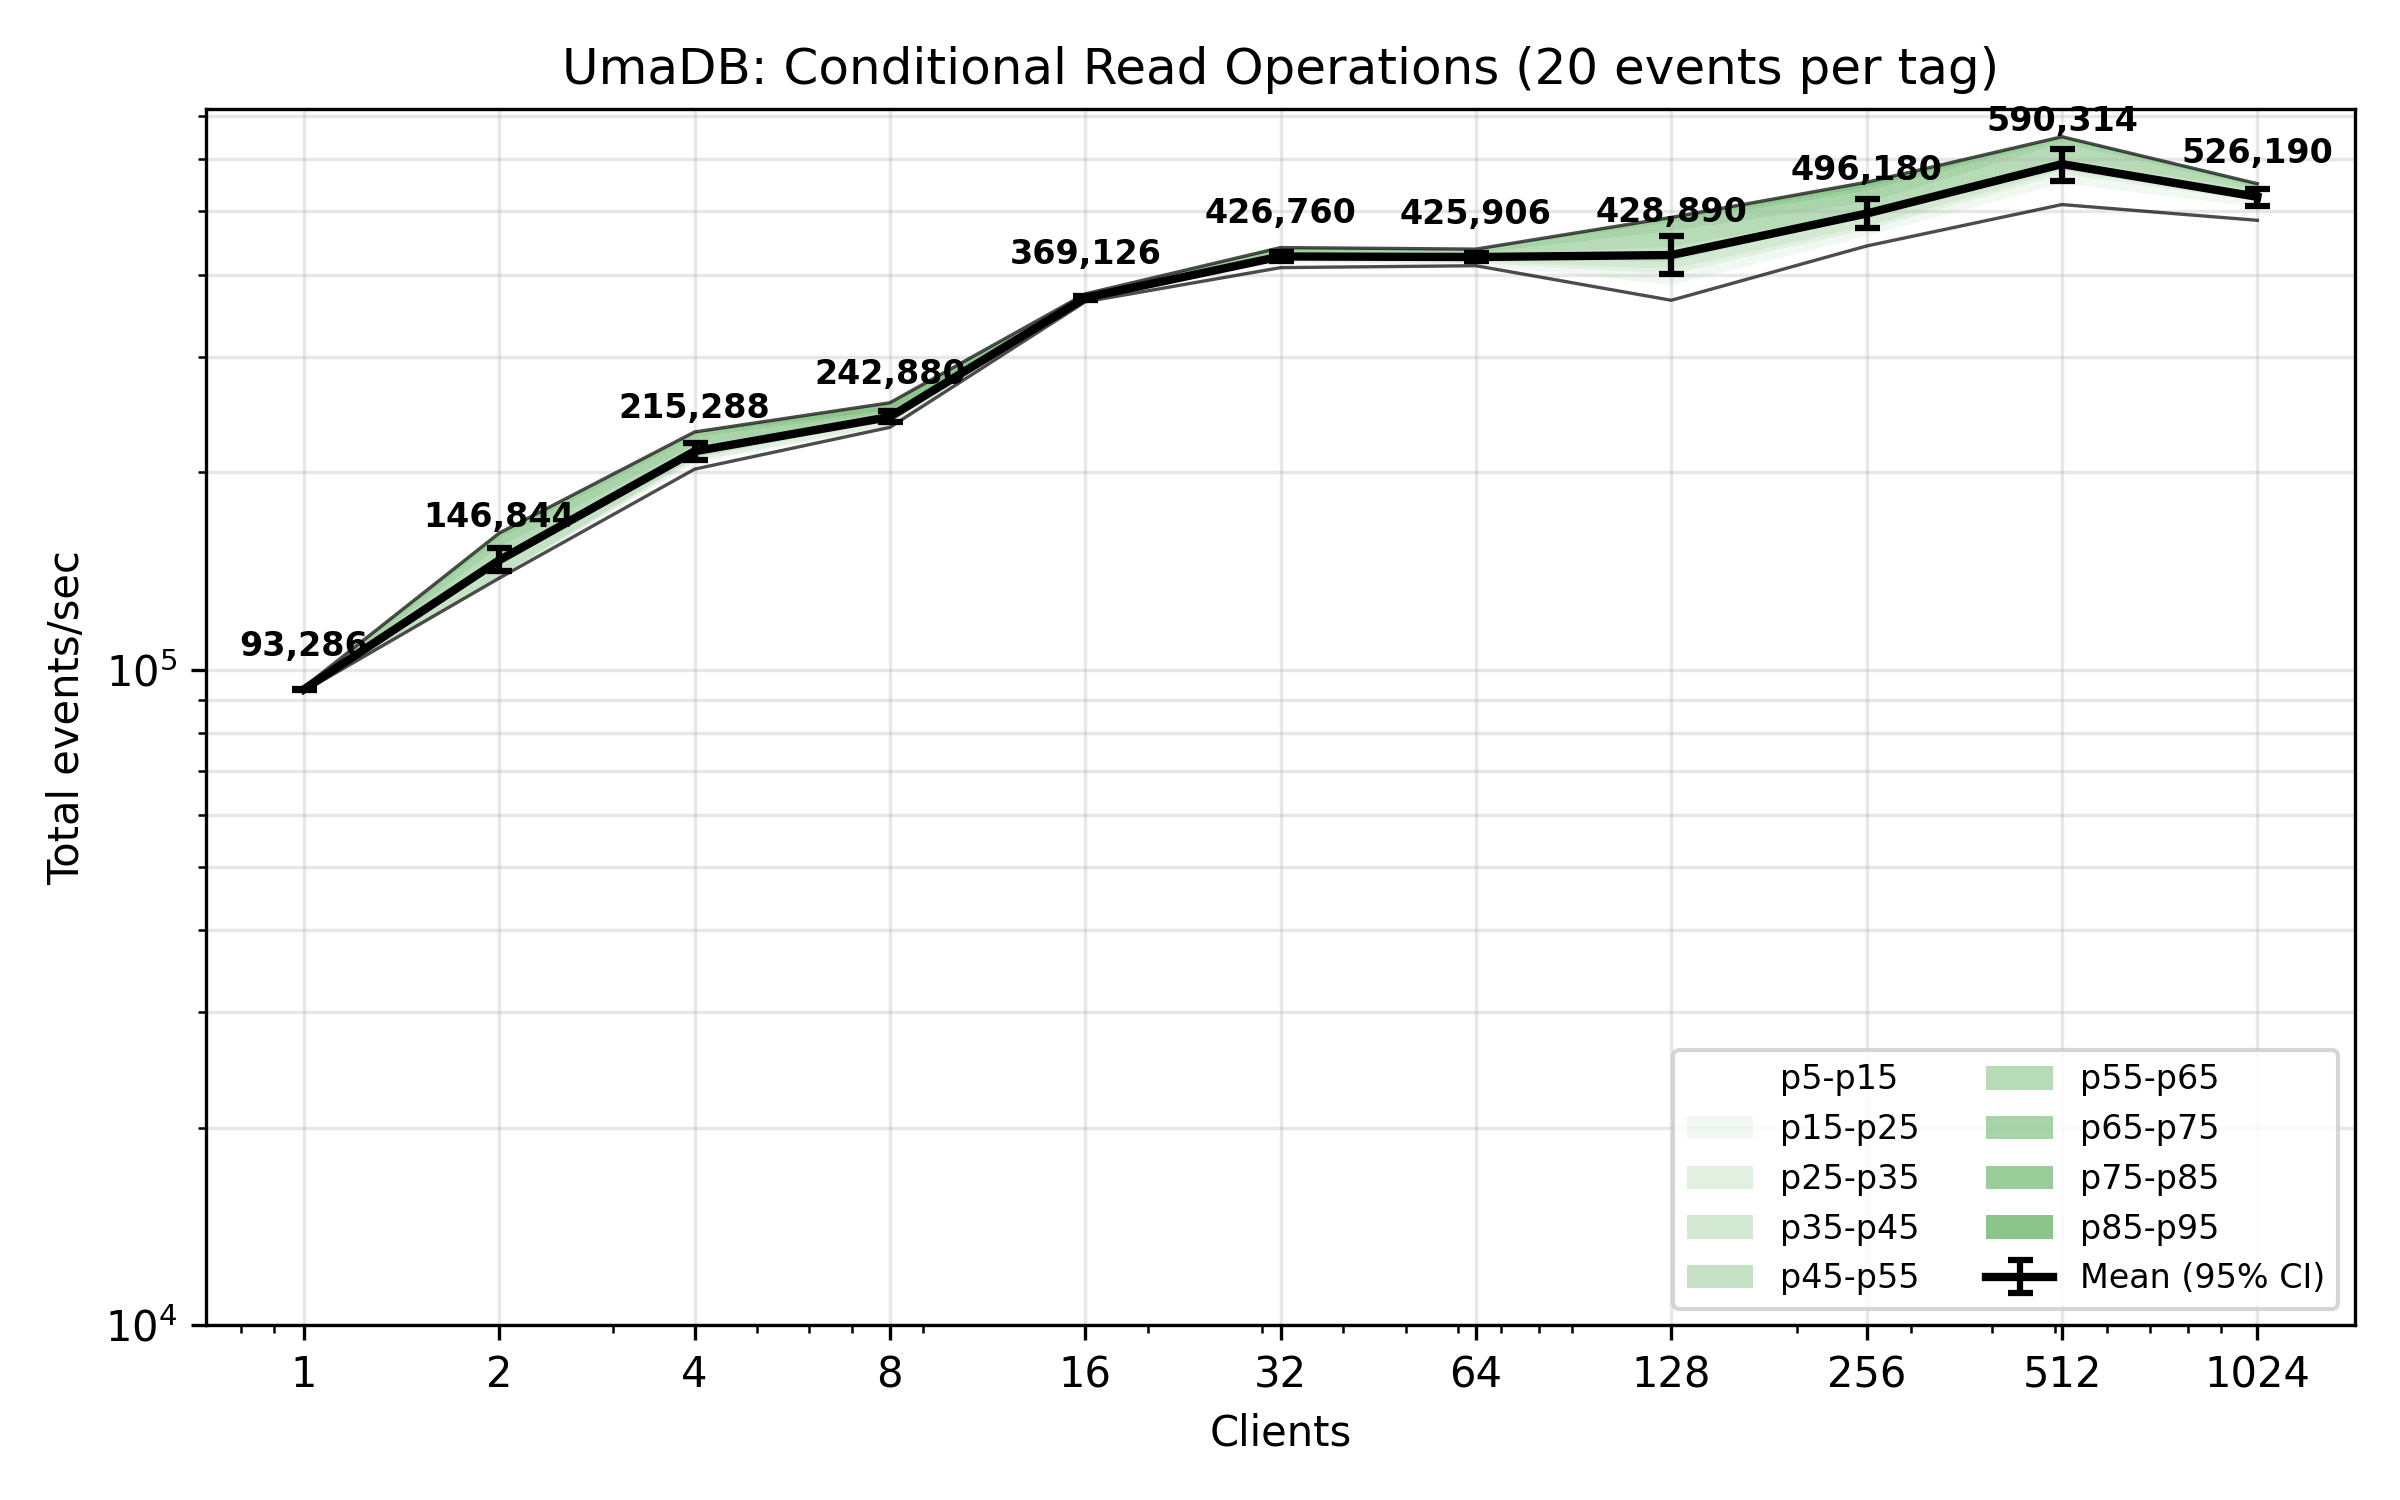
The benchmark plot below shows total events received per second across concurrent client read operations, whilst clients are selecting all events for one tag from a population of 100,000 tags, each of which has 10 recorded events distributed evenly across the total sequence.
This is the kind of reading that might happen whilst building a decision model from which new events are generated.
Unconditional Read
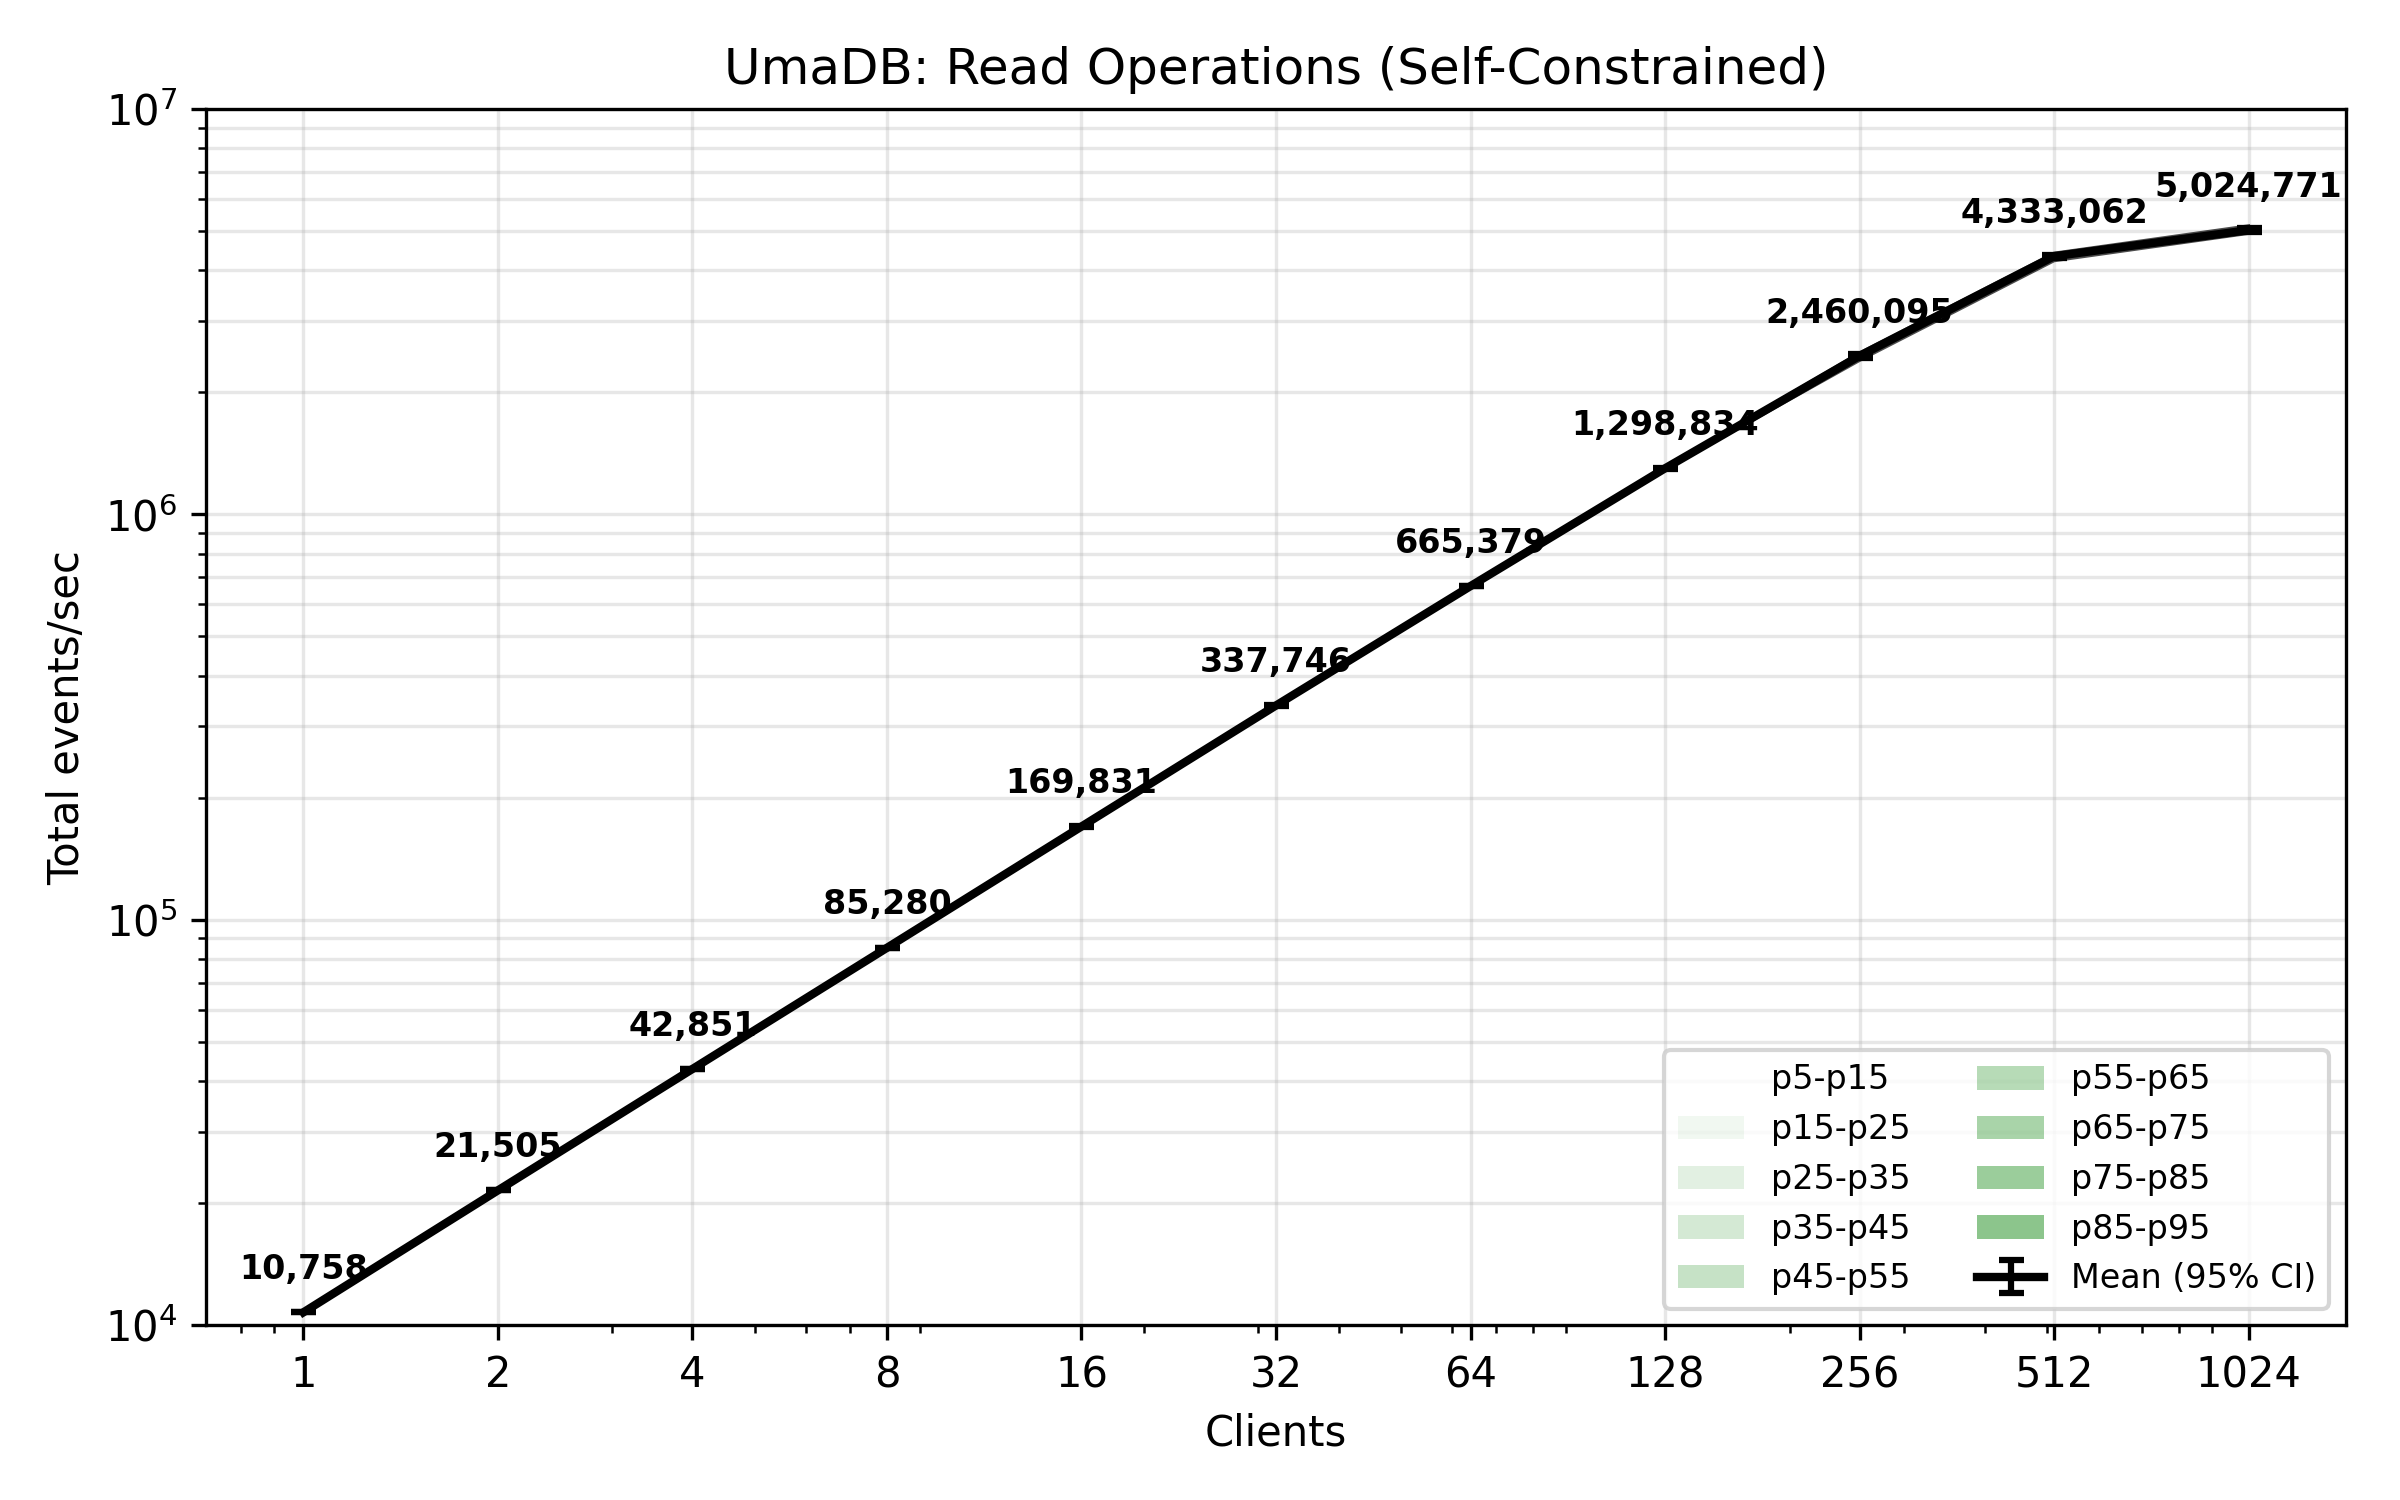
The benchmark plot below shows total events received per second across concurrent client read operations, whilst clients are self-constrained to process events at around 10,000 events per second. This plot shows concurrent readers scale quite linearly.
This is the kind of reading that might happen whilst projecting the state of an application into a materialized view in a downstream event processing component (CQRS).
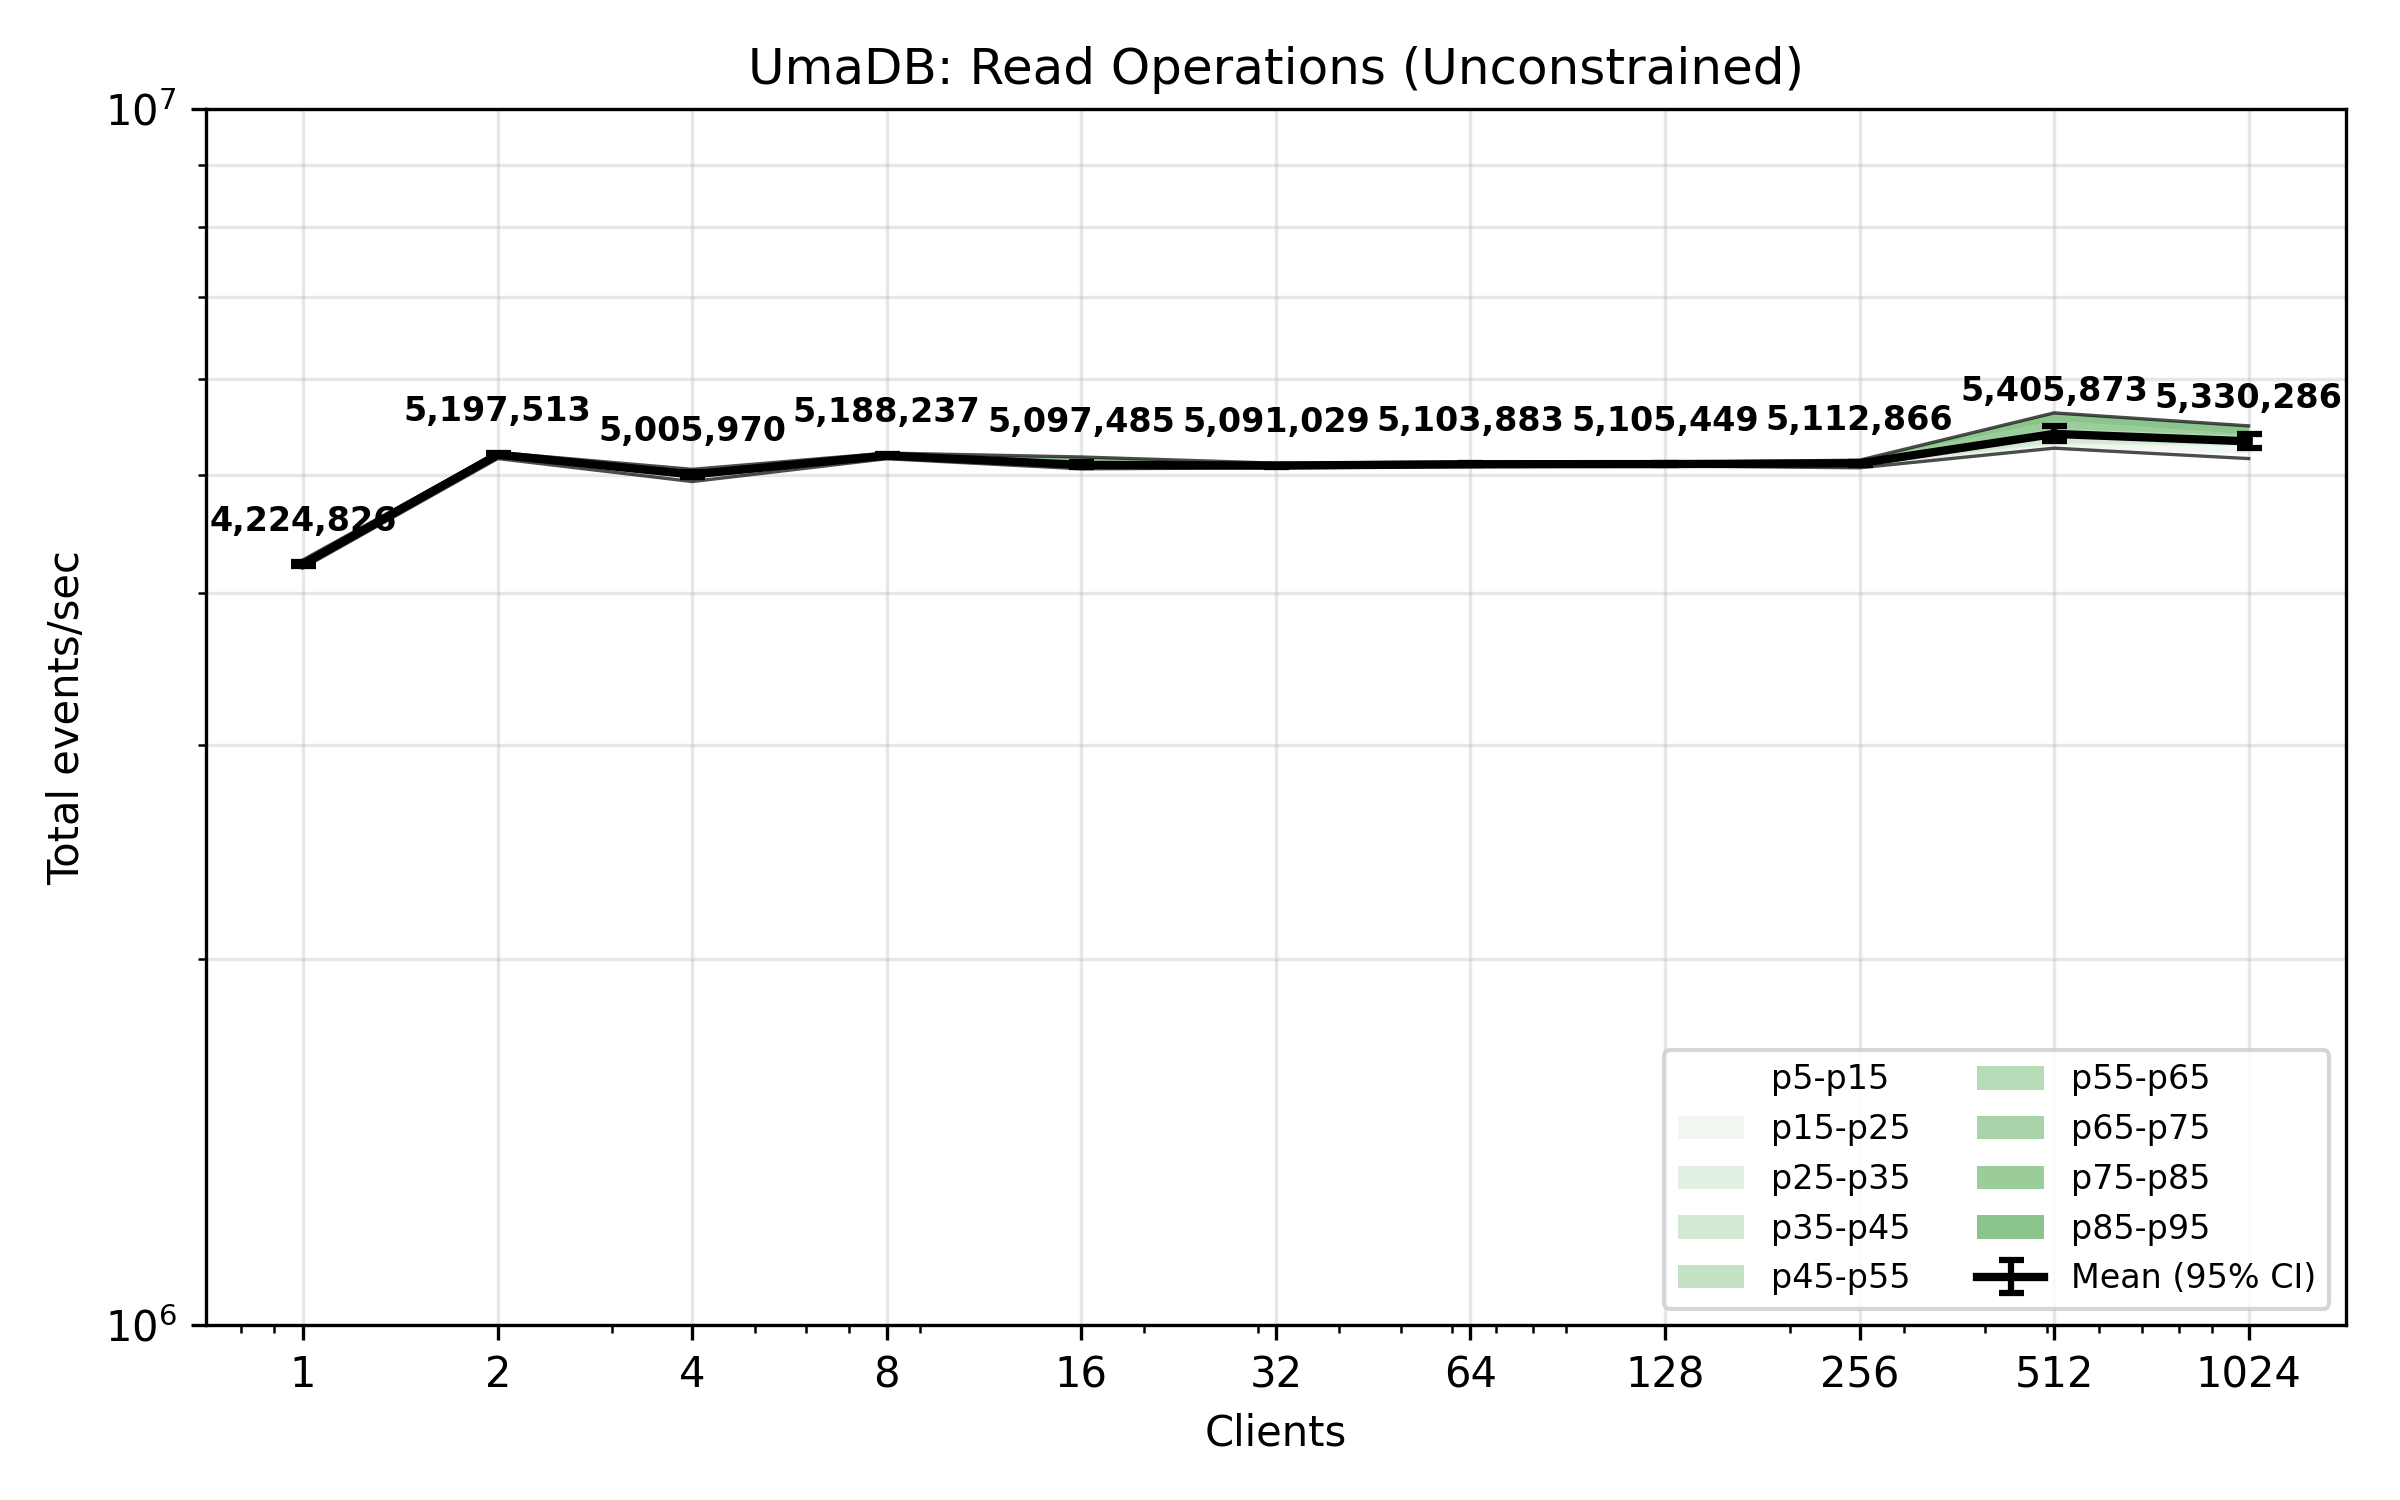
The benchmark plot below shows total events received per second across concurrent client read operations, whilst clients are not self-constrained in their rate of consumption. The rate is ultimately constrained by the CPU and network channel limitations.
Concurrent Reading and Writing
The benchmark plot below shows total appended events per second from concurrent clients, whilst there are four other clients concurrently reading events. Each client is writing one event per request. By comparison with the plots for append operations, this plot shows writing is not drastically impeded by concurrent readers.
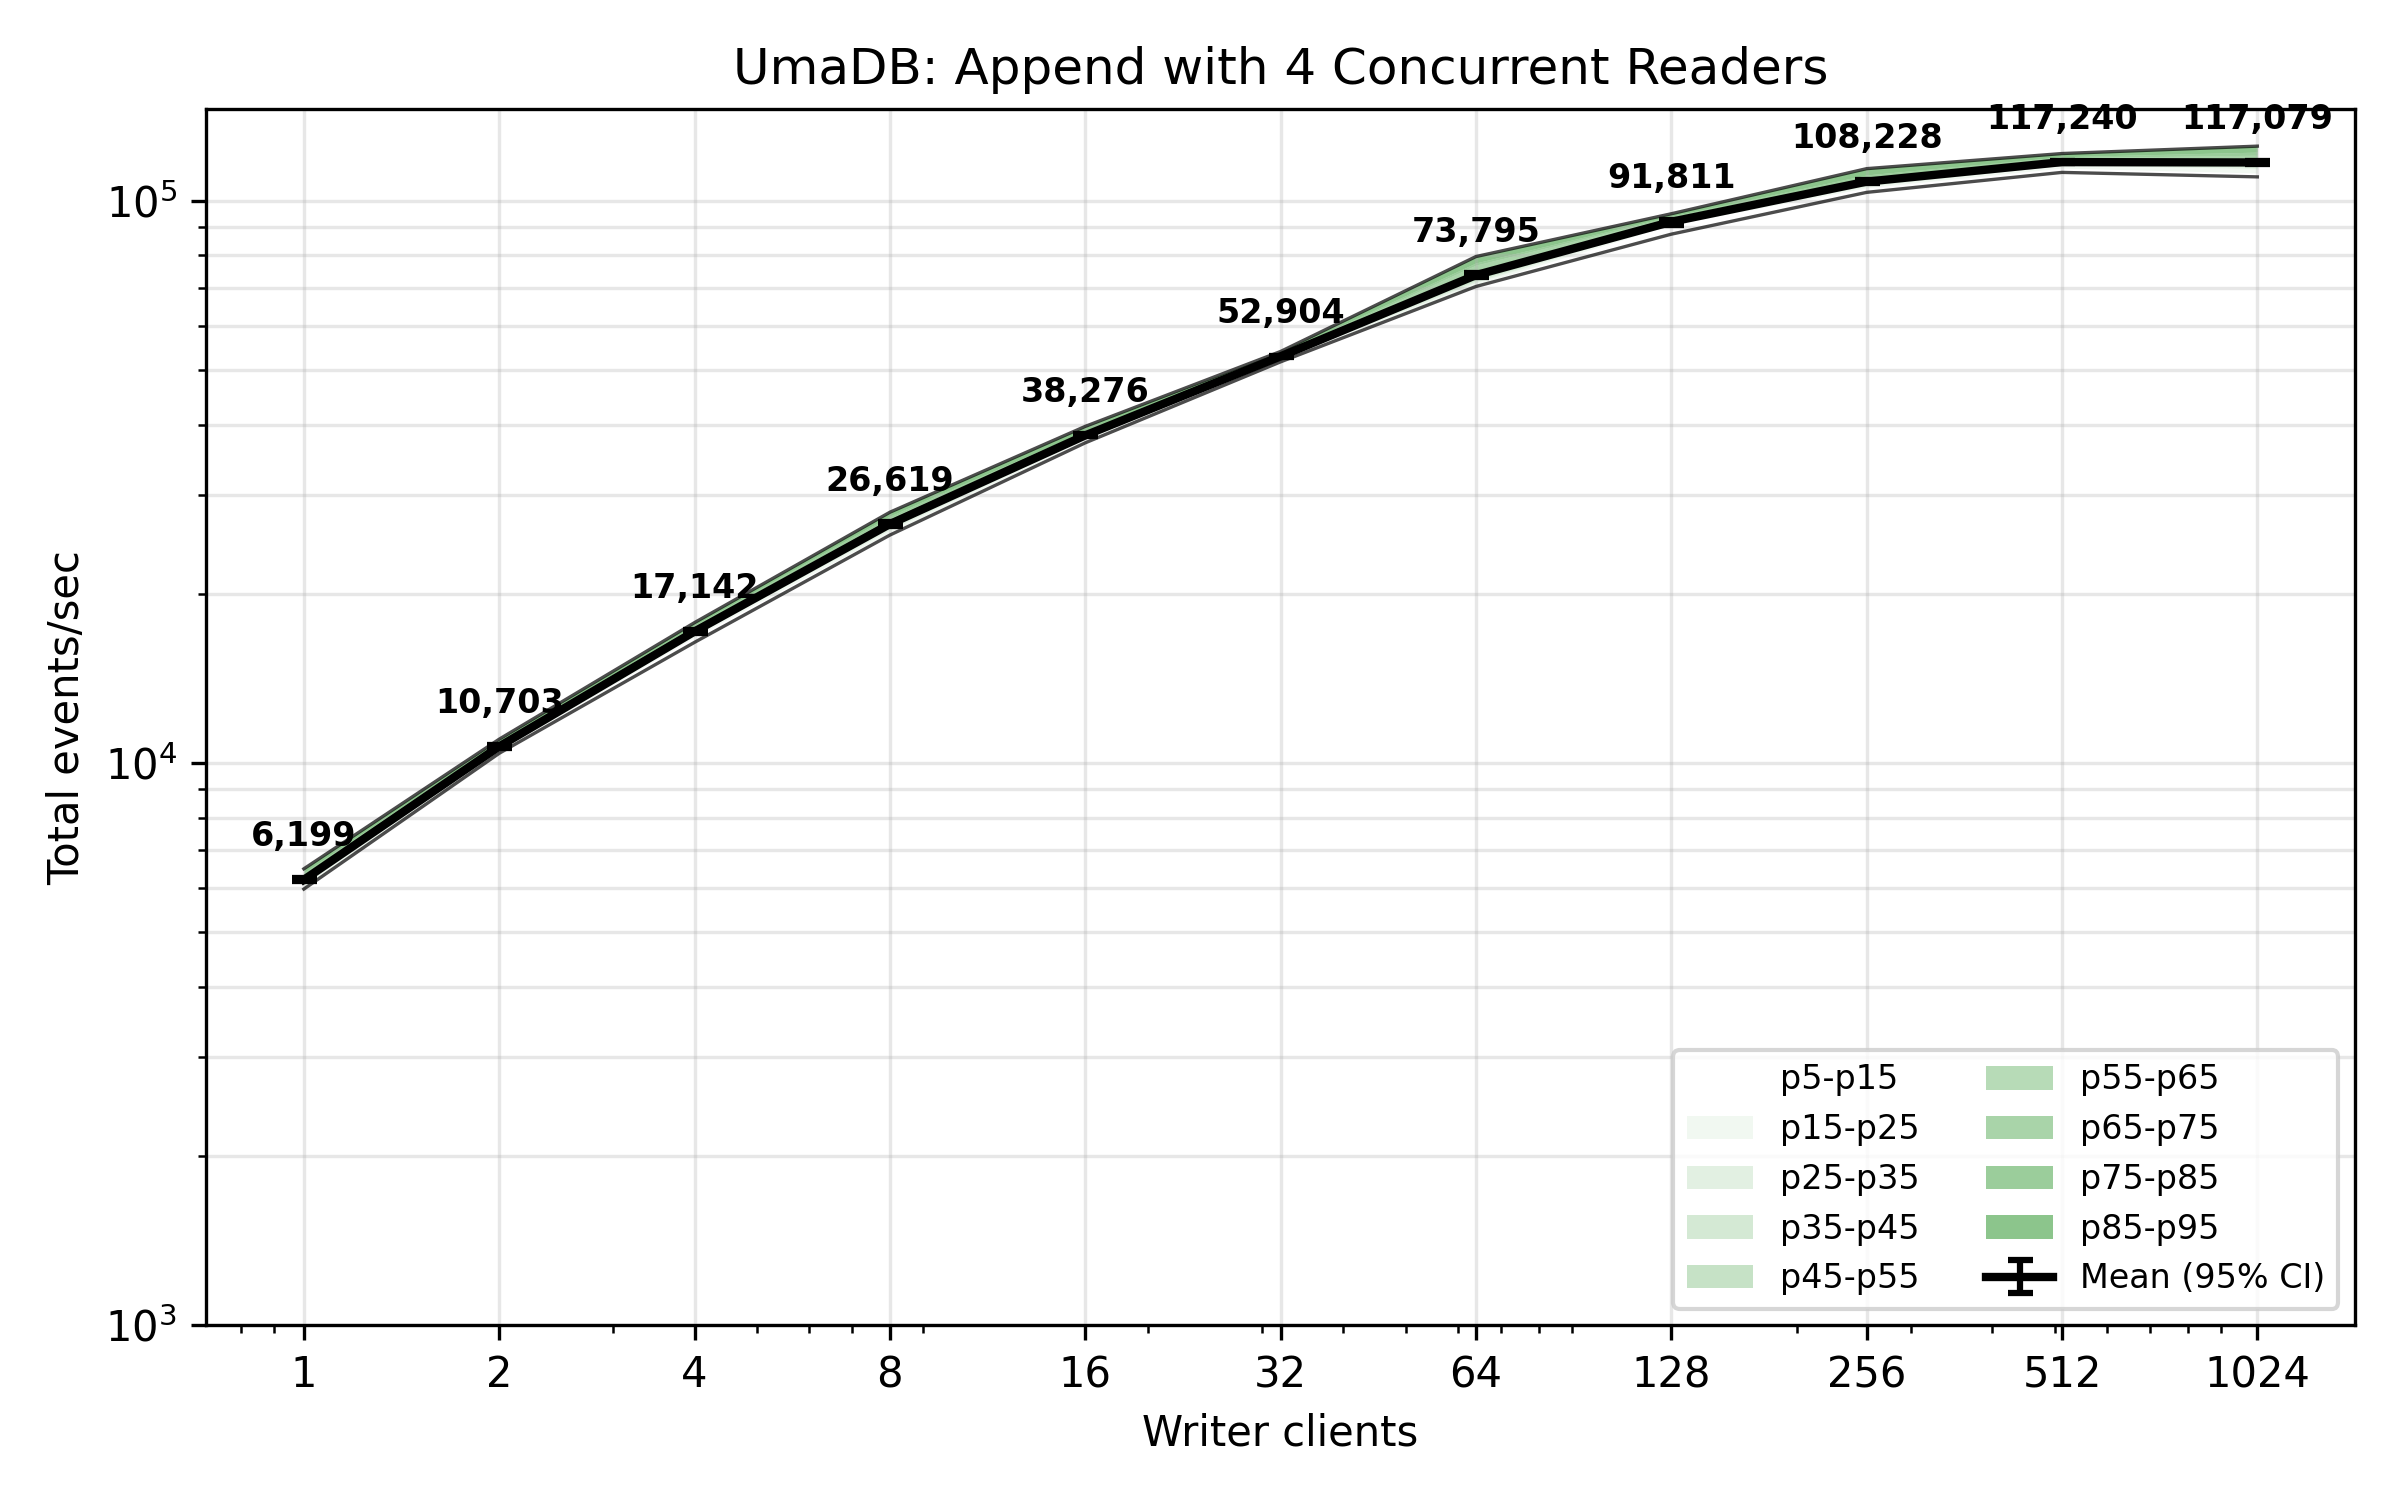
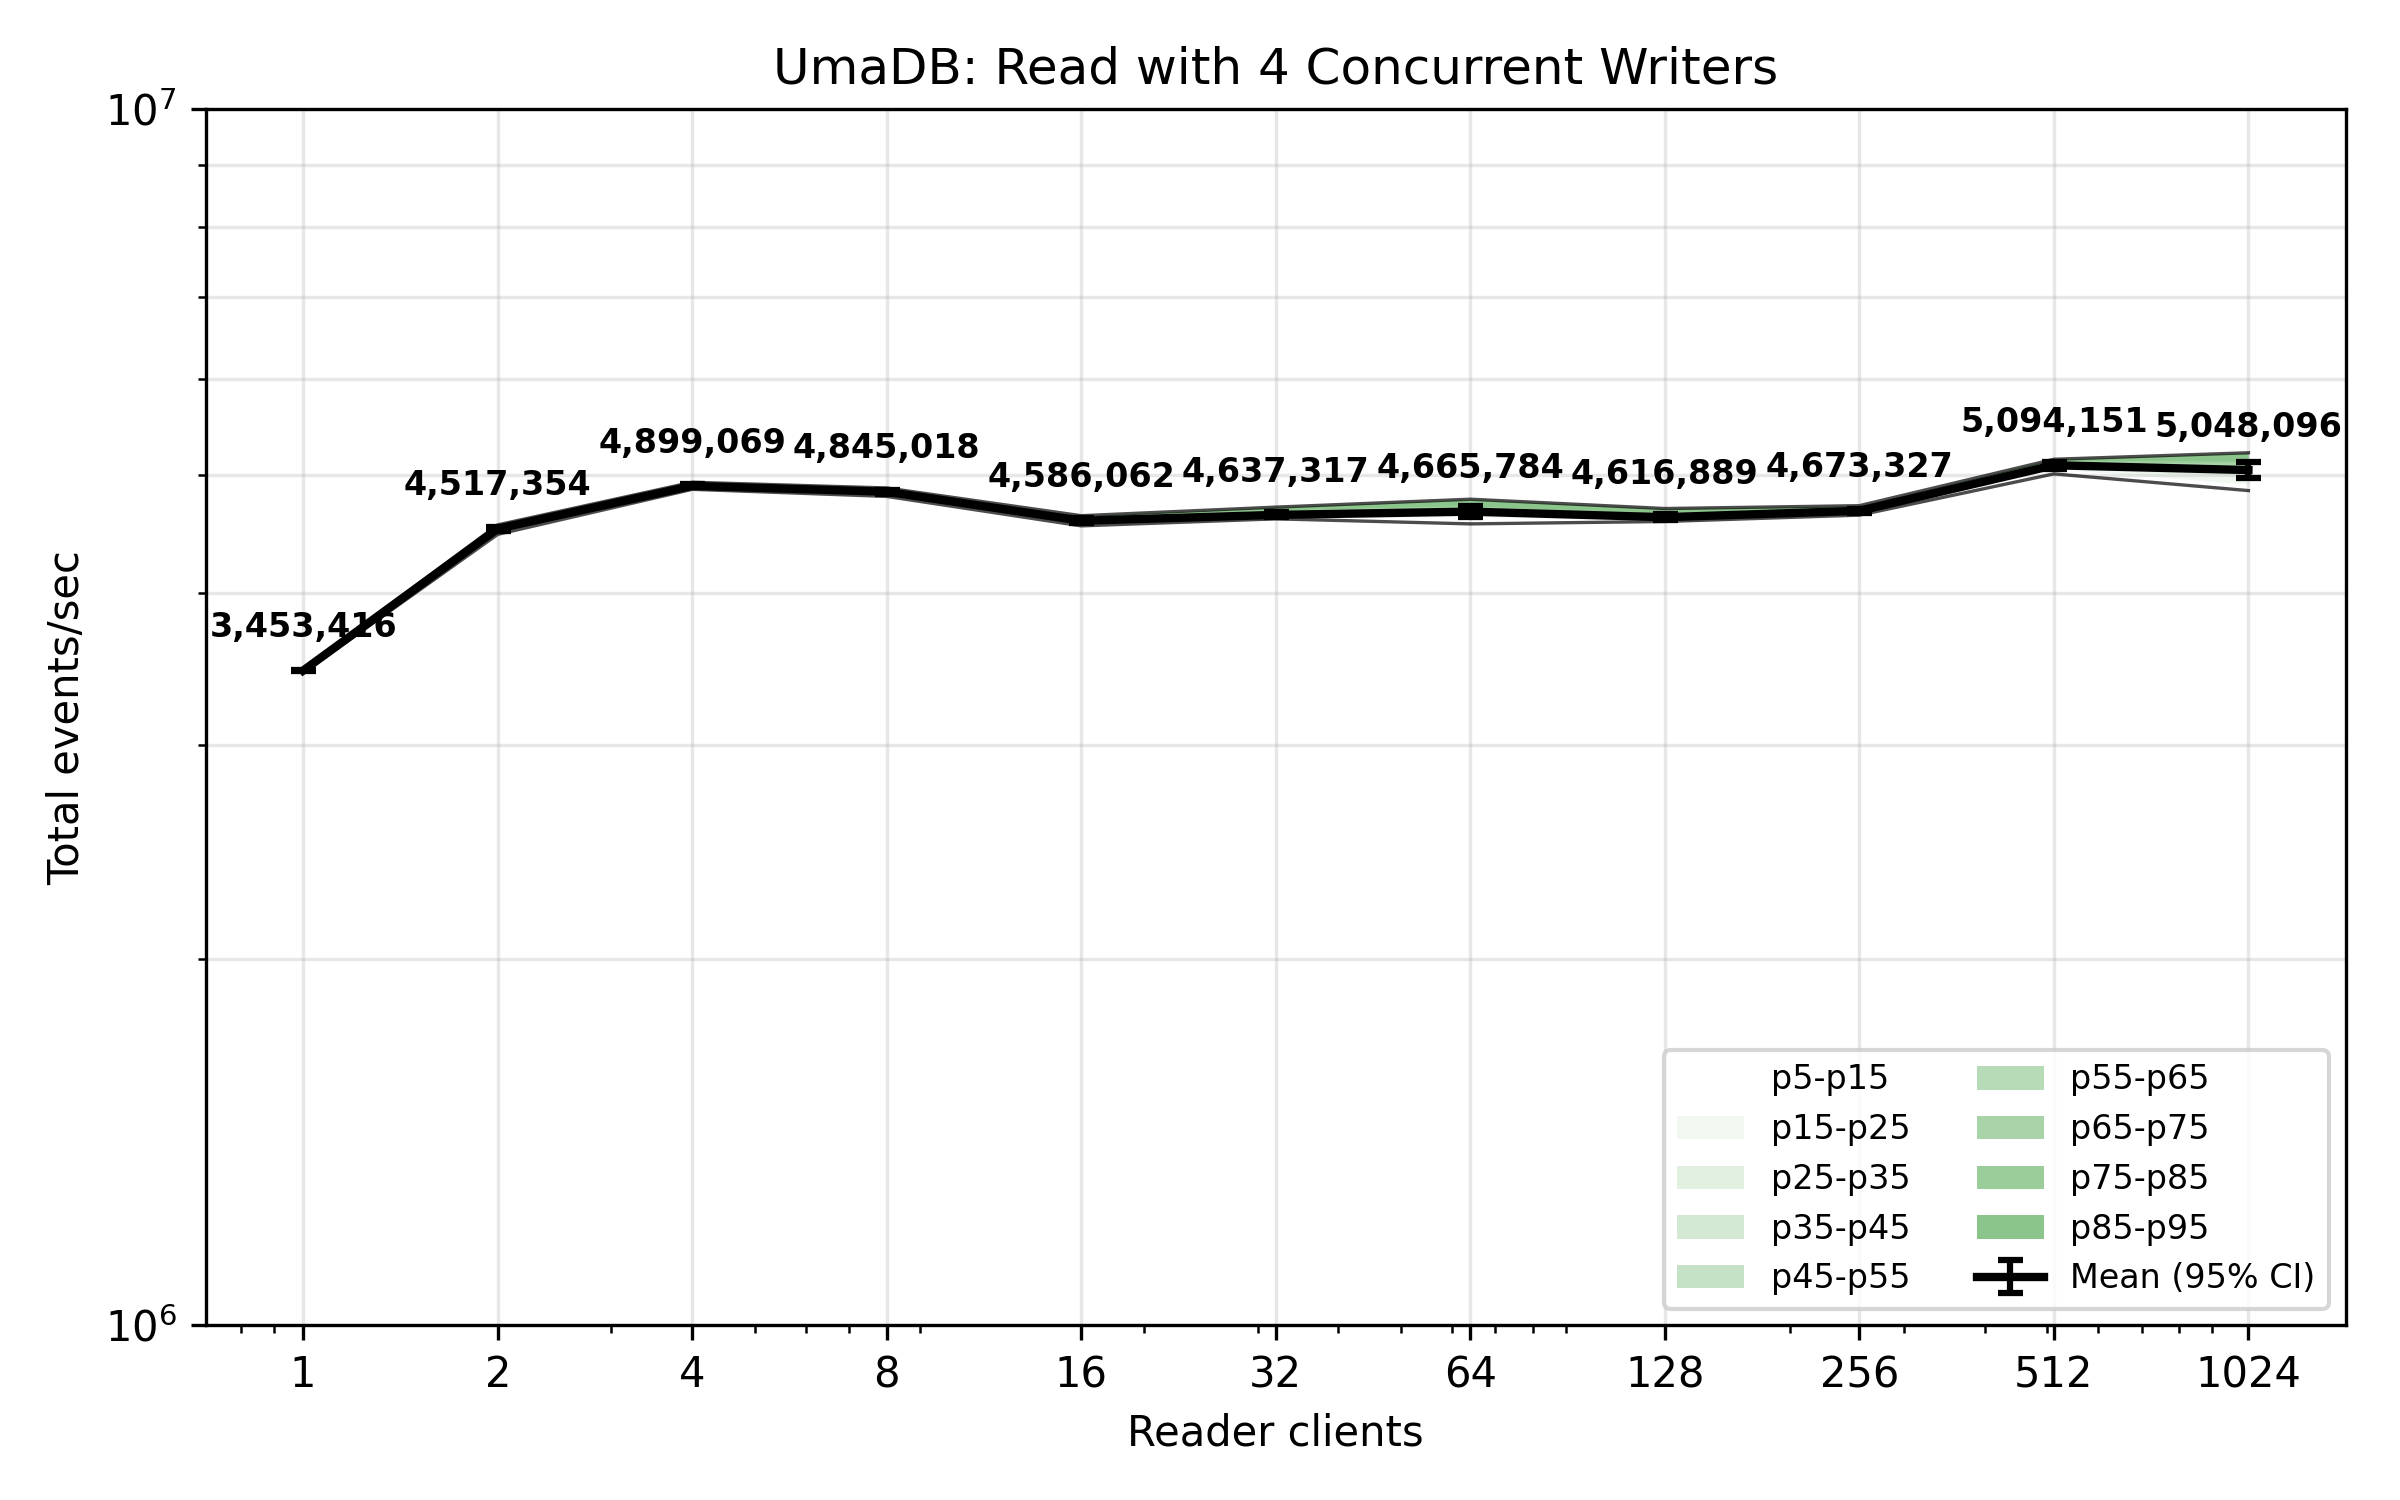
The benchmark plot below shows total events received per second across concurrent client read operations, whilst there are four other clients concurrently appending events. By comparison with the unconstrained read without writers, this plot shows reading is not drastically impeded by concurrent writers.